
As a trader, I remember the early days when I was constantly confused by the different market structures. I would hear terms like “bullish,” “bearish,” and “consolidation” thrown around, and I had no idea how to apply these concepts to my trades. One day, after a series of frustrating losses, I decided to dig deeper into the fundamental structures that govern price movements. I took the time to understand market structure, particularly the bullish market structure, and it completely changed the way I approached trading.
Table Of Content
- What is a Bullish Market Structure?
- Why is This Important for Traders?
- How to Identify a Bullish Market Structure
- 1. Spotting the Higher Highs and Higher Lows
- Example of a Bullish Market Structure
- 2. Identifying Support and Resistance Levels
- Key Strategies to Trade in a Bullish Market Structure
- 1. Buying the Dip
- 2. Breakout Trading
- 3. Trend-Following Indicators
- What Happens When There is a Possible Shift from Bullish to Bearish?
- Scenario 1: Trend Reversal from Bullish to Bearish
- Scenario 2: Consolidation and Continuation
- Scenario 3: Bear Trap
- Common Mistakes to Avoid in a Bullish Market Structure
- Some Examples of the Bullish Market Structure
- Frequently Asked Questions (FAQs)
- What does a bullish market structure indicate?
- How can I trade in a bullish market structure?
- What is the best indicator for confirming a bullish trend?
- What is a bear trap in a bullish market?
- How do I know when a bullish market structure is ending?
- Can a bullish market structure continue forever?
- Conclusion
In this comprehensive guide, we’ll break down the concept of a bullish market structure with clear examples, practical insights, and strategies. By the end of this post, you’ll have a solid understanding of how to identify a bullish market structure and how to use it to make more informed trading decisions. This guide will not only help you avoid counter-trend trading but also boost your chances of profitability.
What is a Bullish Market Structure?
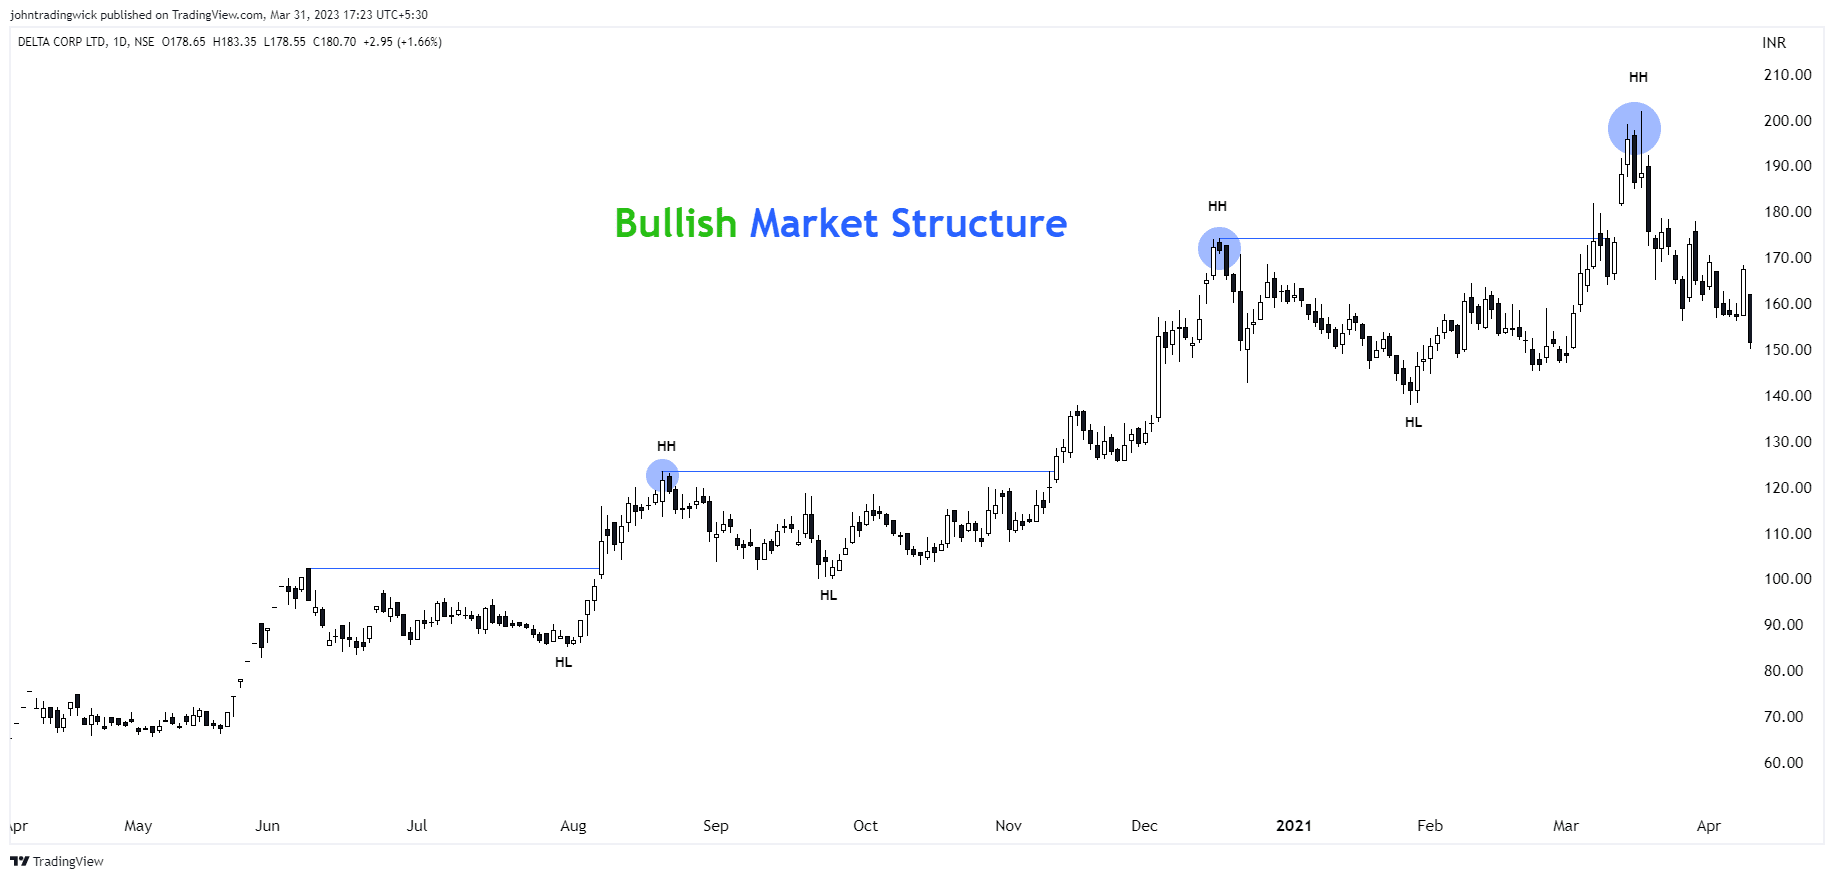
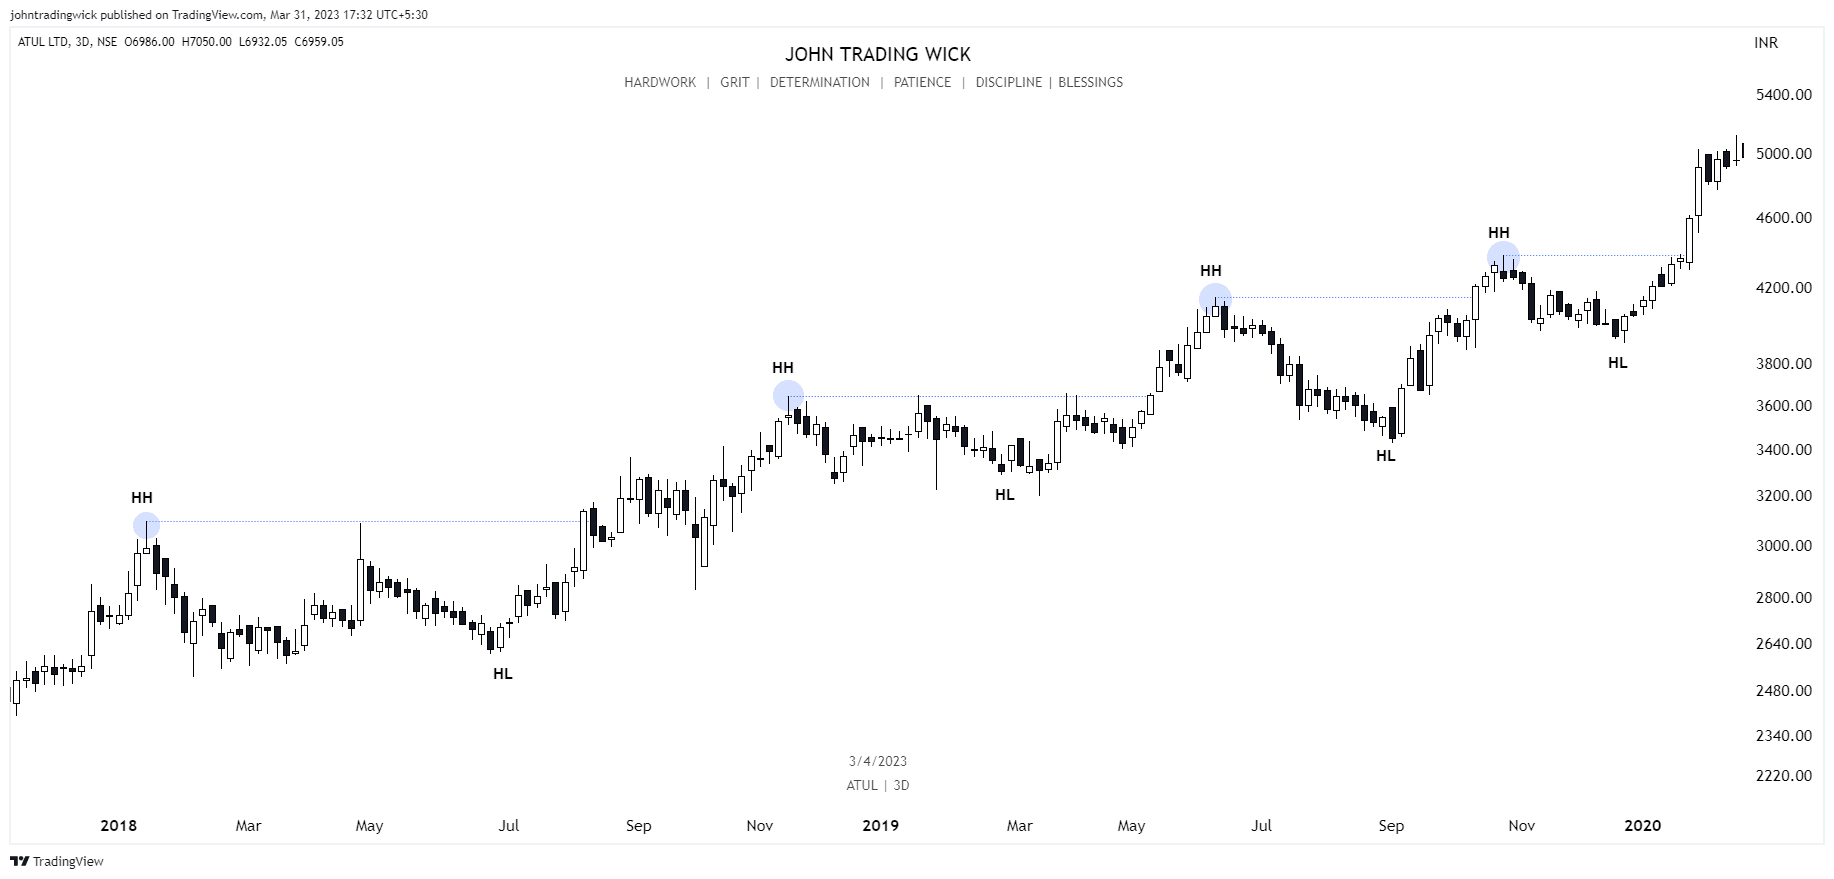
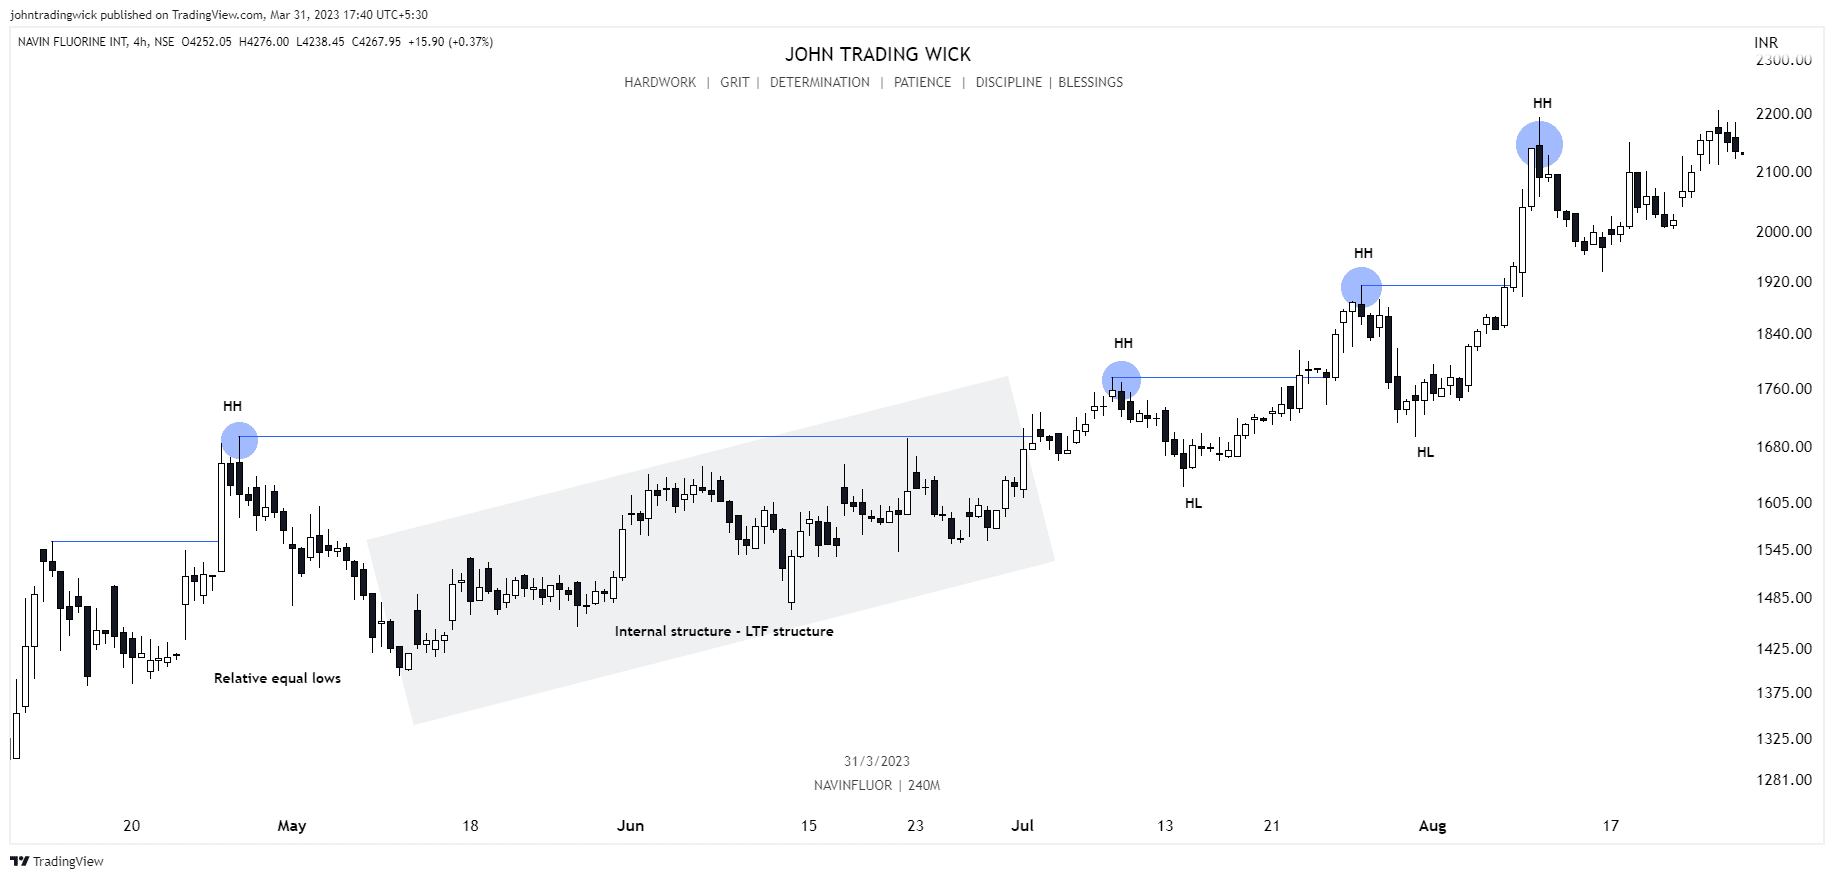
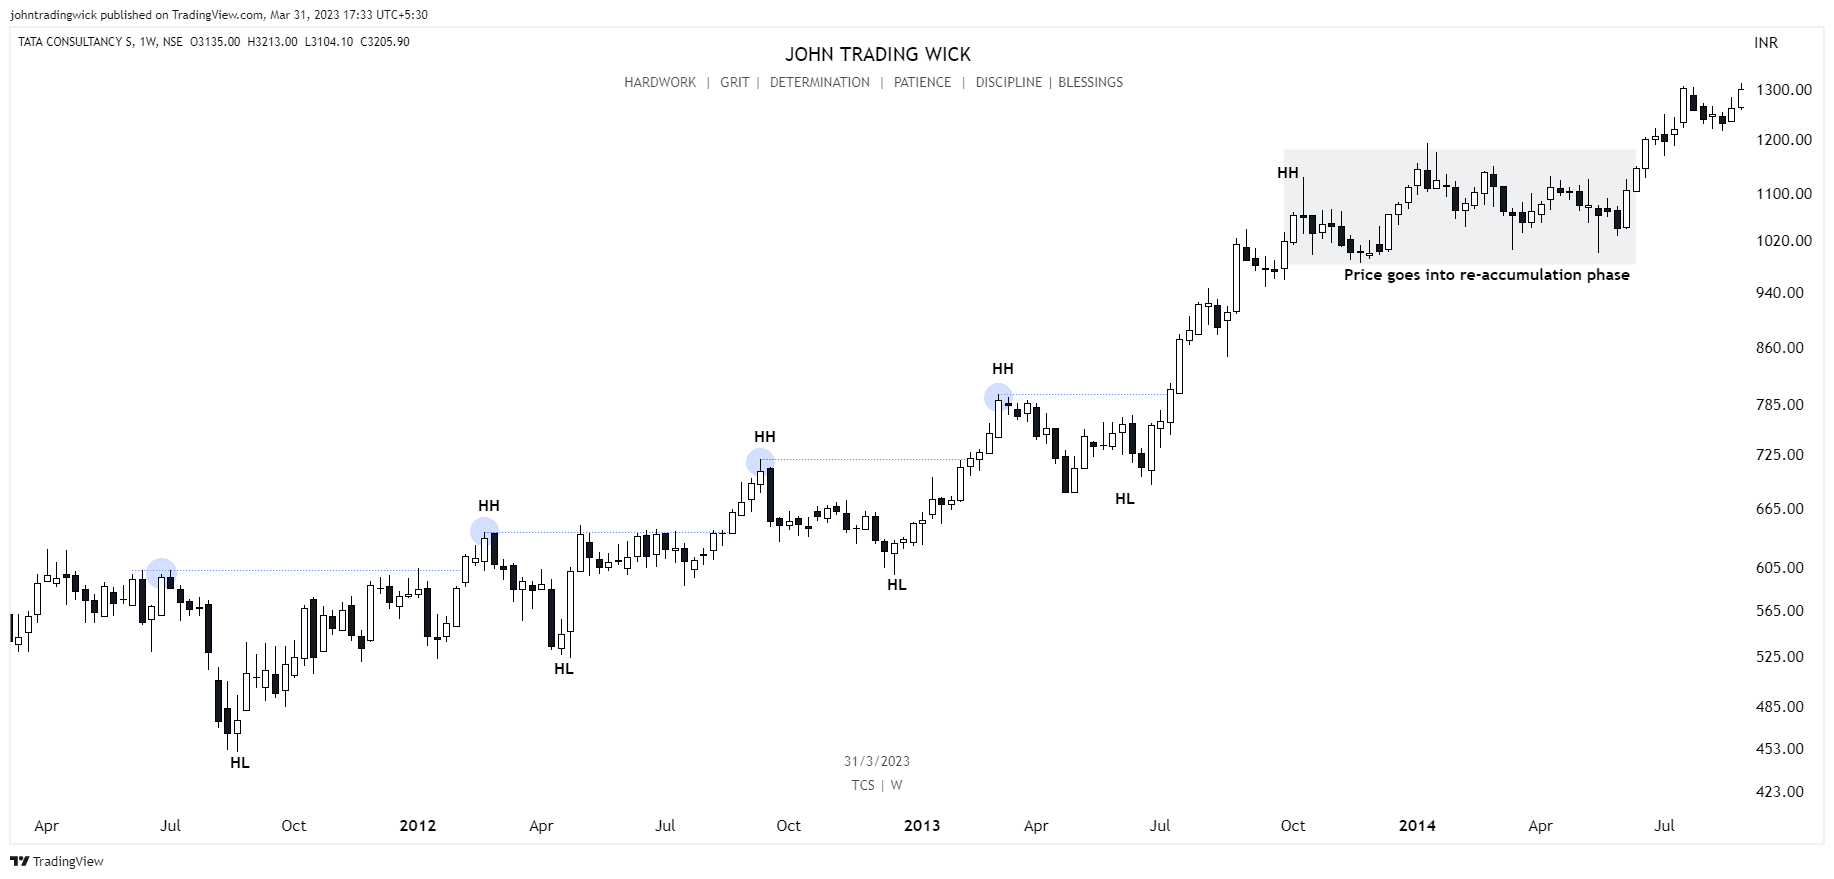
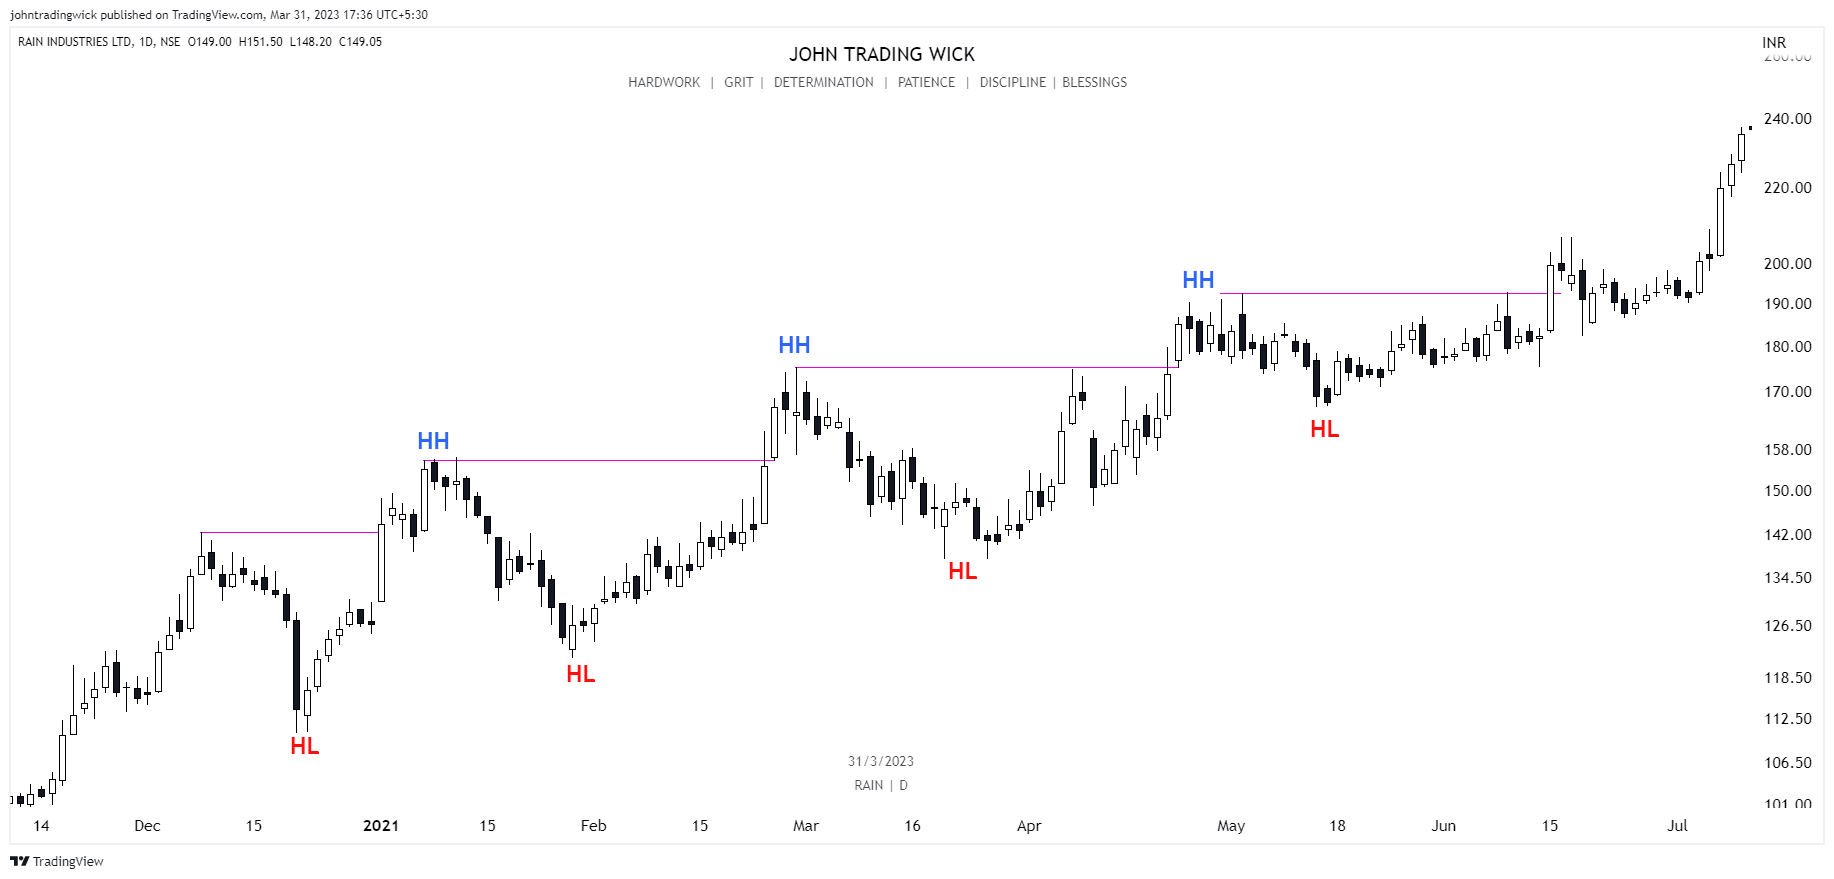
A bullish market structure refers to the series of higher highs and higher lows that form when a market is in an uptrend. In simple terms, when prices consistently move upward, each peak (high) is higher than the previous one, and each trough (low) is also higher than the last one. This structure signals that demand is greater than supply, and buyers are in control.
Let’s break this down step by step:
- Higher Highs – As the market moves upwards, it creates peaks that are higher than the previous ones. These peaks represent resistance levels.
- Higher Lows – As the market pulls back, it creates dips (lows) that are still higher than the previous ones. These dips represent support levels.
In essence, the market is continuously moving upward in a series of increasing peaks and increasing troughs.
Why is This Important for Traders?
Understanding a bullish market structure is crucial because it allows traders to align themselves with the market. When the market is bullish, buying at support levels (the higher lows) gives you the opportunity to enter trades at relatively lower prices before the price continues its upward movement.
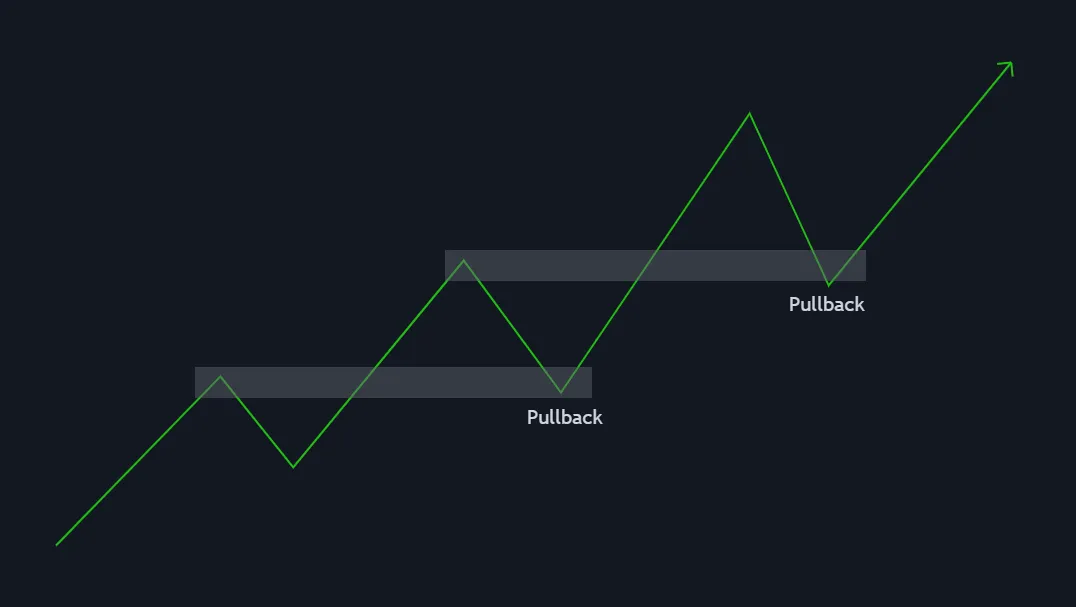
This is often referred to as “buying the dip” – entering the market when it temporarily pulls back, expecting the upward trend to continue. By identifying the bullish market structure, traders can avoid fighting the trend and instead maximize their profits by entering trades that align with the prevailing trend.
How to Identify a Bullish Market Structure
1. Spotting the Higher Highs and Higher Lows
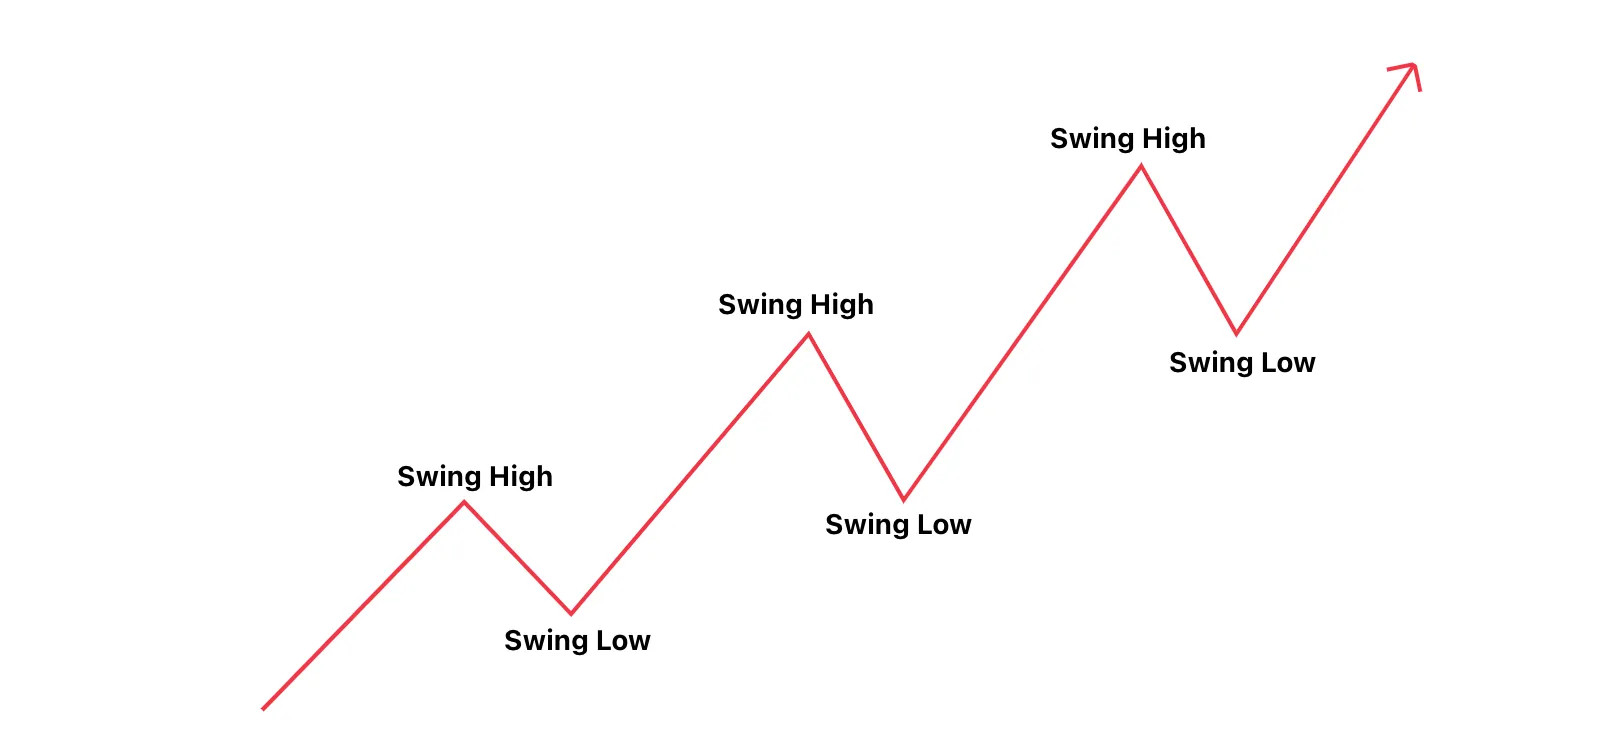
As mentioned earlier, the fundamental characteristic of a bullish market is the series of higher highs and higher lows. These two elements are the building blocks of the market structure.
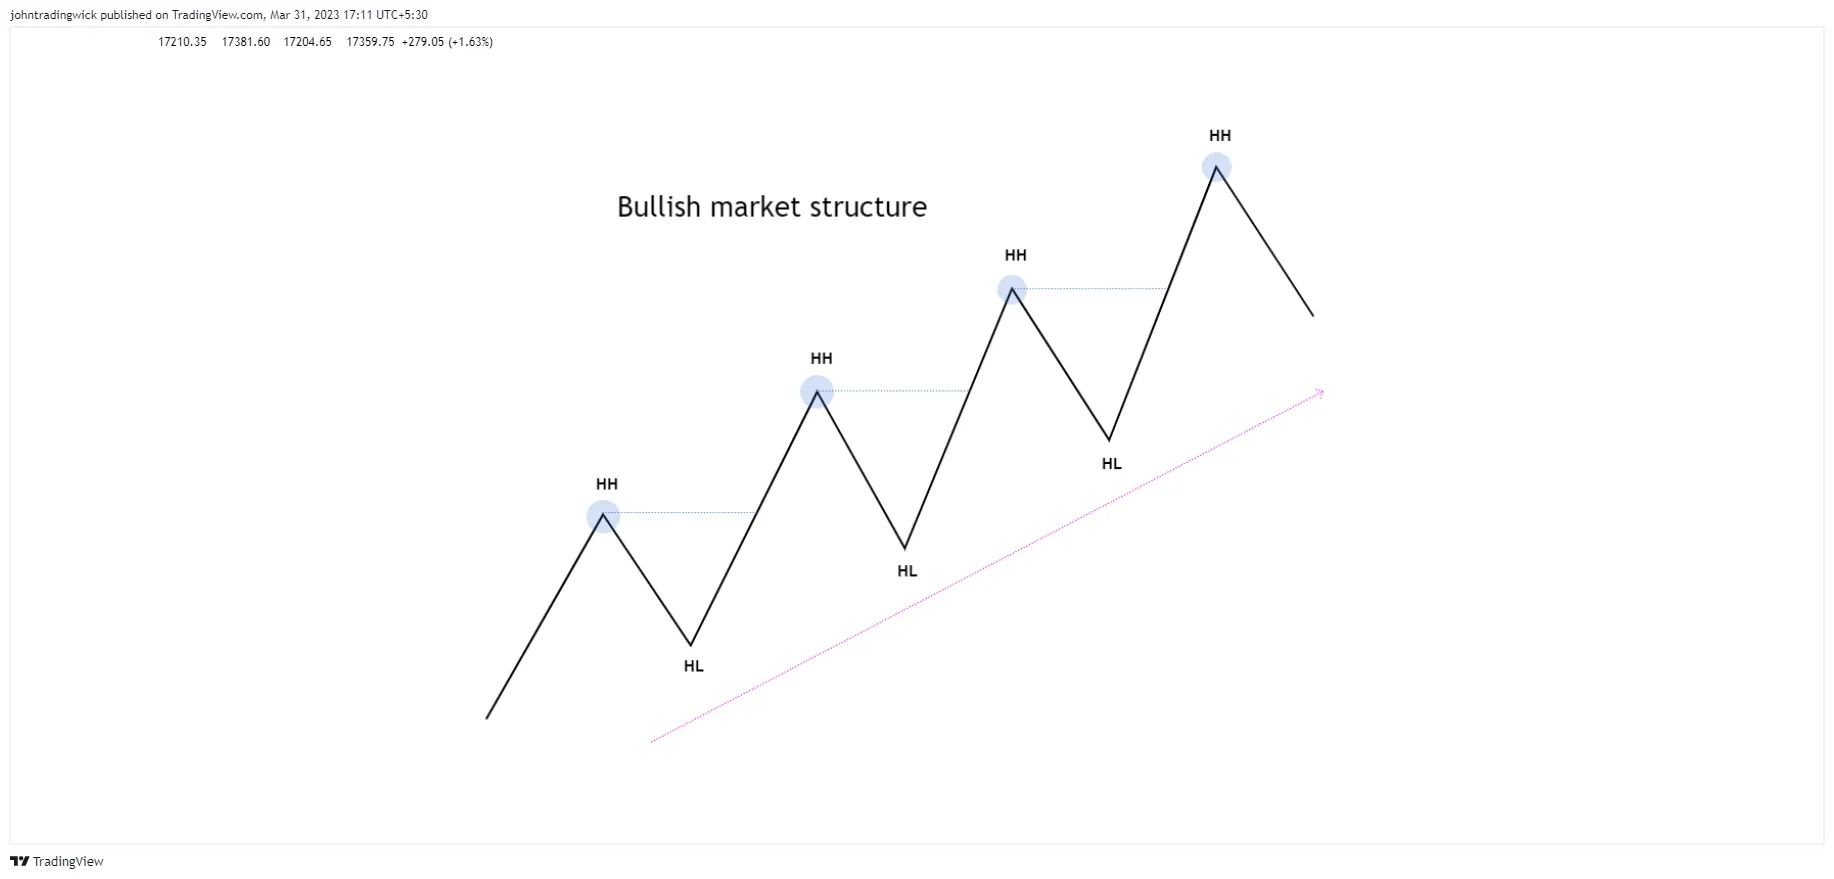
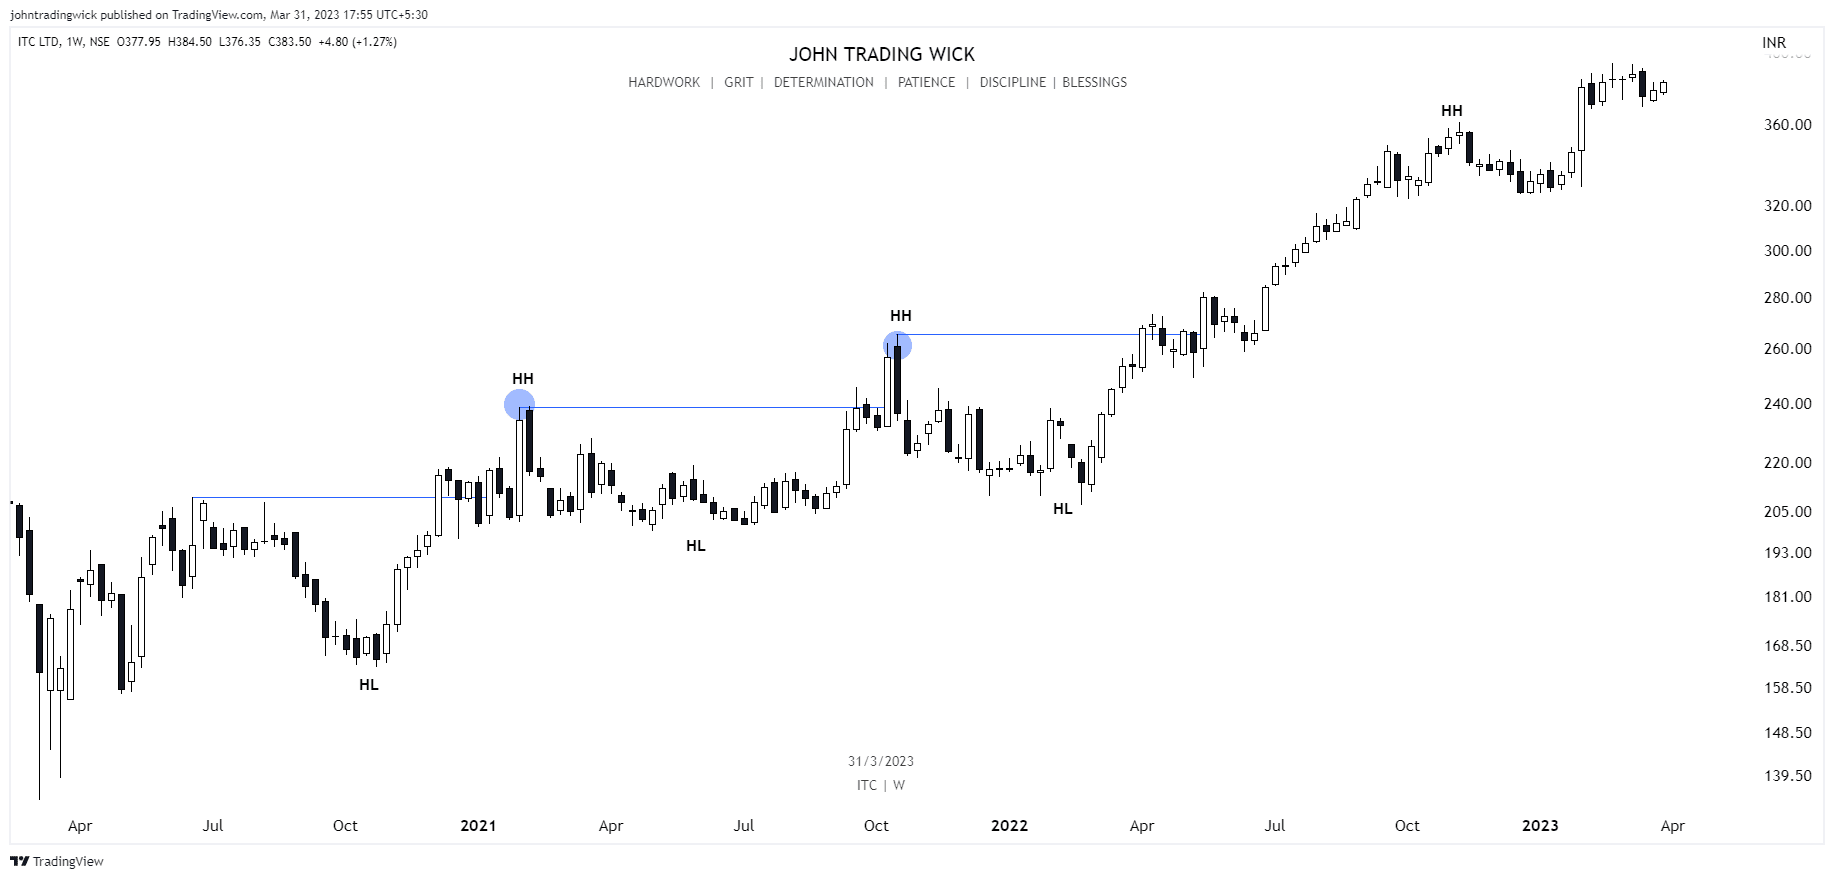
- Higher Highs (HH): The price action consistently makes higher peaks, indicating a strong upward momentum.
- Higher Lows (HL): After each upward movement, the price pulls back but doesn’t fall lower than the previous low, suggesting that demand is consistently overpowering the selling pressure.
Example of a Bullish Market Structure
Imagine the market has made a high at $100, pulled back to $90, and then rallies up to $110. This is your first higher high. When the price pulls back again to $95, this forms your first higher low. If the price continues to rise to $120 and the subsequent pullback stays above $95, then this is another higher low. You now have a confirmed bullish market structure with higher highs and higher lows.
2. Identifying Support and Resistance Levels
In a bullish market, previous highs often serve as support levels, and traders may look to buy when the price pulls back to these levels. Similarly, the new highs become resistance levels that may act as potential sell targets or areas where profit-taking could occur.
Key Strategies to Trade in a Bullish Market Structure
Now that you understand how to spot a bullish market structure, let’s dive into some practical trading strategies.
1. Buying the Dip
This strategy involves entering long positions when the price pulls back to a higher low. Since the trend is bullish, the assumption is that the market will resume its upward movement after the pullback.
For instance, if you spot that the price has made a higher high and is now pulling back to a previous higher low, this could present a solid buying opportunity. Entering at the support level allows you to take advantage of the next price surge when the uptrend resumes.
2. Breakout Trading
Another strategy is breakout trading. In a bullish market, price tends to make new highs as the trend continues. When the price breaks above a previous high (resistance), it signals a continuation of the uptrend. Traders often enter positions at this breakout point, riding the momentum of the continuing uptrend.
For example, if the price has been consolidating between $100 and $105, and then breaks above $105, it could signal that the bullish market is set to continue. Traders would buy at this breakout point, anticipating a move towards higher levels.
3. Trend-Following Indicators
You can also use trend-following indicators such as the Moving Average (MA), Relative Strength Index (RSI), and MACD to confirm the bullish trend. These indicators can help you gauge the strength of the trend and avoid prematurely entering trades.
For instance, if the price is consistently above the 200-period MA, it suggests that the long-term trend is bullish. Additionally, the RSI could be used to ensure that the market is not overbought (above 70), as buying at overbought levels could lead to a poor risk-to-reward ratio.
What Happens When There is a Possible Shift from Bullish to Bearish?
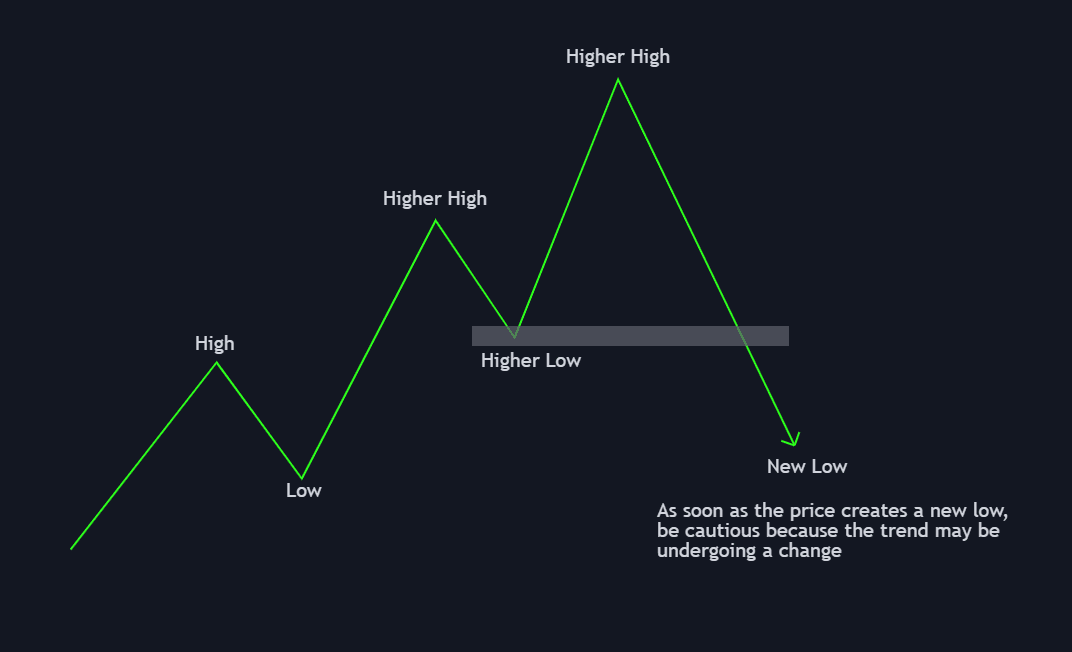
In some cases, the market structure may show signs of changing direction. Understanding these potential shifts is critical for managing risk.
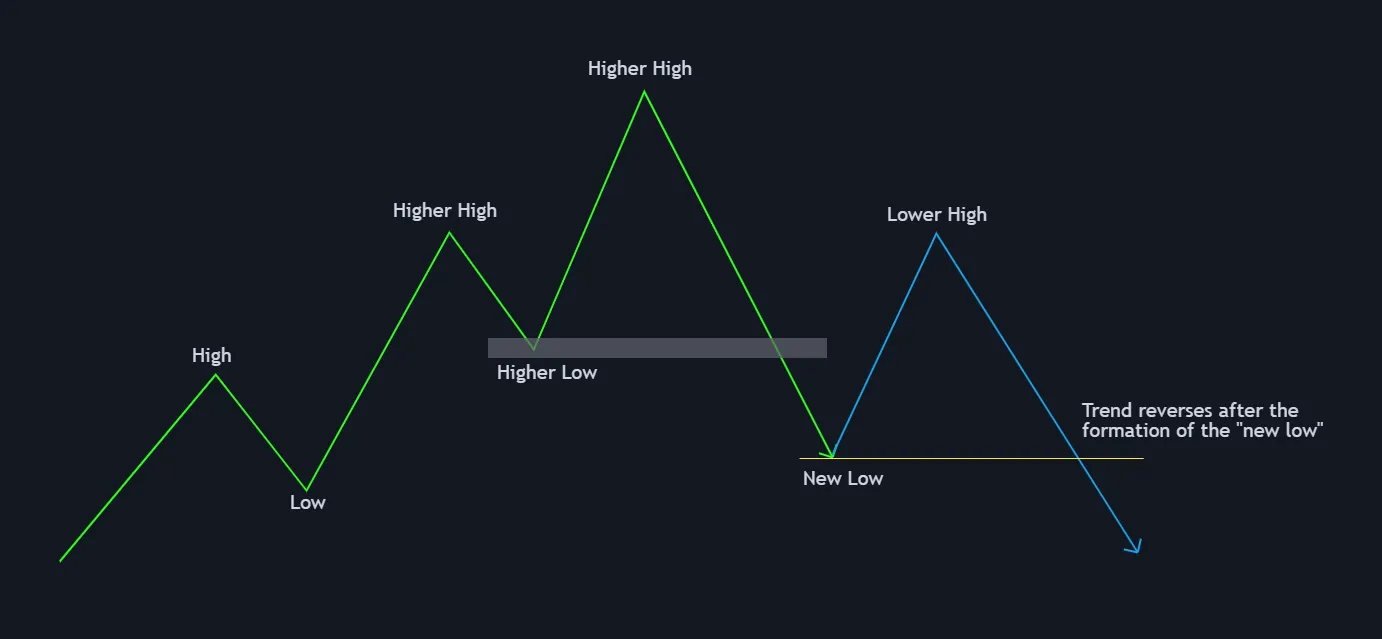
Scenario 1: Trend Reversal from Bullish to Bearish
A trend reversal occurs when the price makes a lower low followed by a lower high, breaking the previous higher low. This signals a shift from a bullish trend to a bearish one. Traders should be cautious and consider exiting long positions or even opening short positions if the reversal is confirmed.
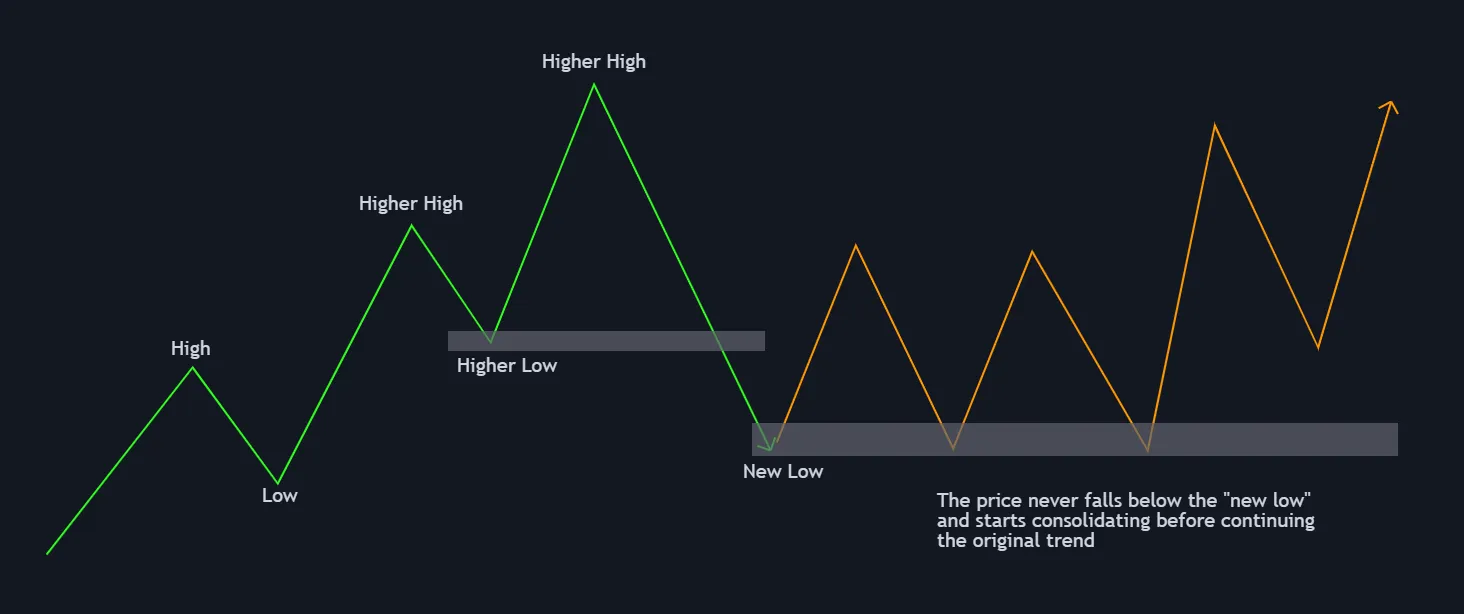
Scenario 2: Consolidation and Continuation
Sometimes, after the price makes a new low, it may enter a period of consolidation. This means the price stays within a range, neither moving up nor down significantly. If the price holds above the recent low and eventually breaks to the upside, it may signal that the bullish trend is resuming.
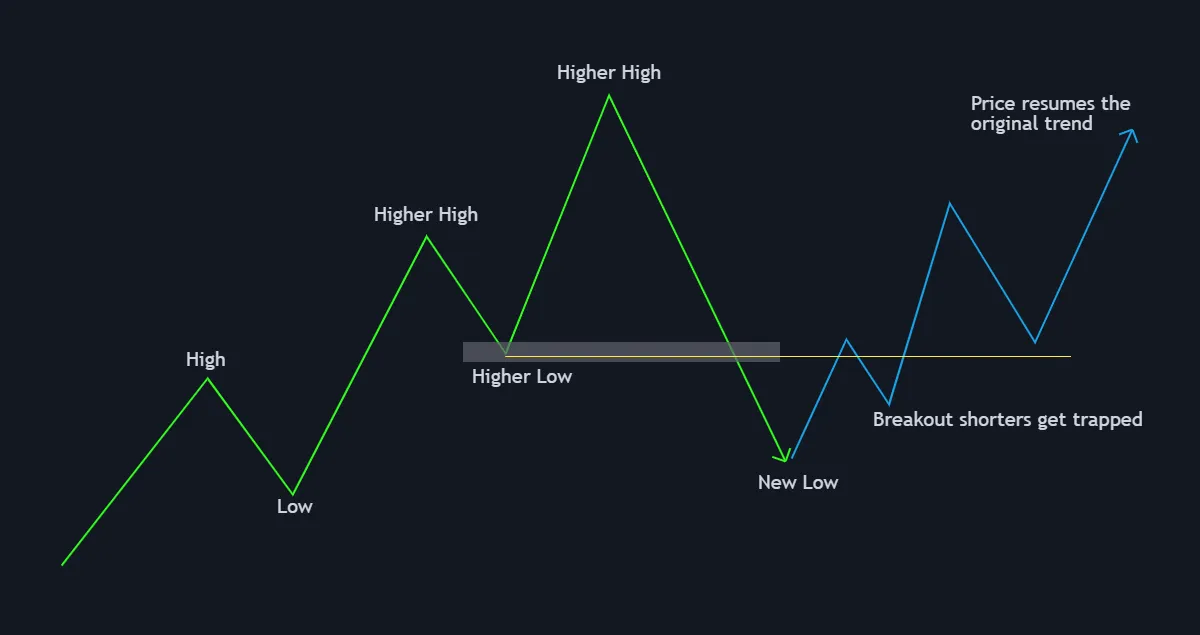
Scenario 3: Bear Trap
A bear trap occurs when the price briefly breaks below a previous support level (higher low) and then quickly reverses back up. Traders who expected a downtrend may have entered short positions, but the market traps them as the price moves back upward. Understanding and identifying bear traps is crucial for avoiding unnecessary losses.
Common Mistakes to Avoid in a Bullish Market Structure
- Fighting the Trend: One of the most common mistakes new traders make is trying to trade against the trend. In a bullish market, it’s important to stay aligned with the trend and avoid shorting or going against the flow of the market.
- Entering Too Early: Patience is key. Jumping into trades too early during a pullback or breakout can lead to missed opportunities or losses. Wait for confirmation that the market is resuming its bullish trend before entering.
- Ignoring Risk Management: Even in a bullish market, risk management is crucial. Always use stop-loss orders to protect your trades in case the market unexpectedly reverses.
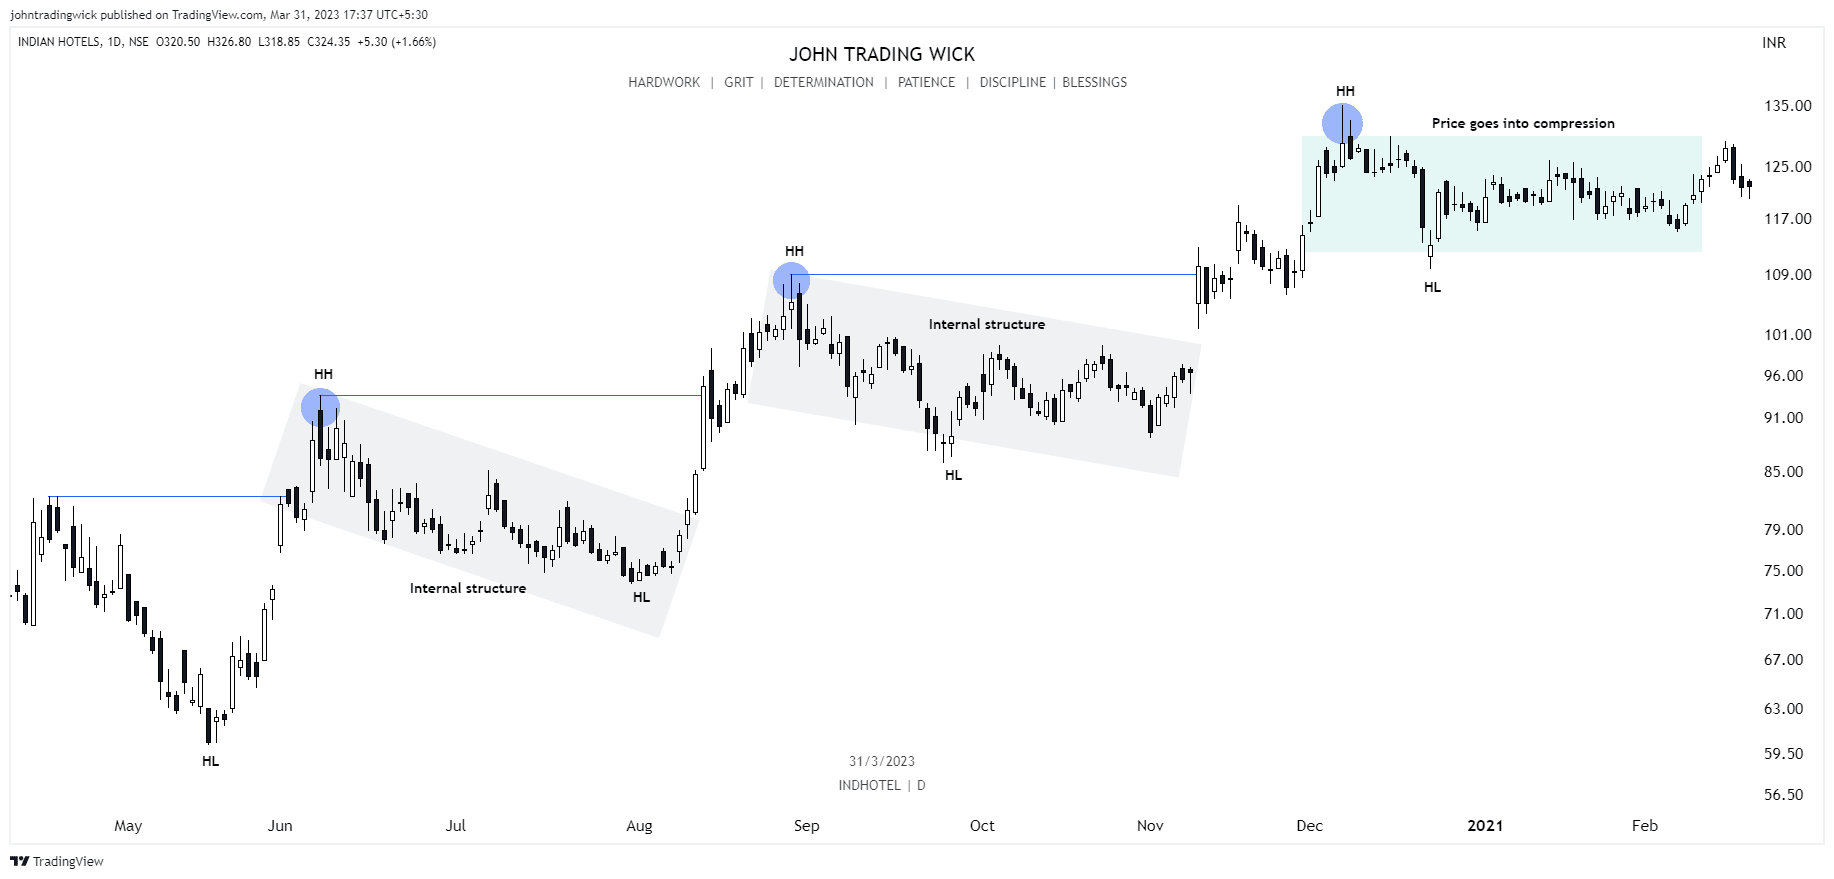
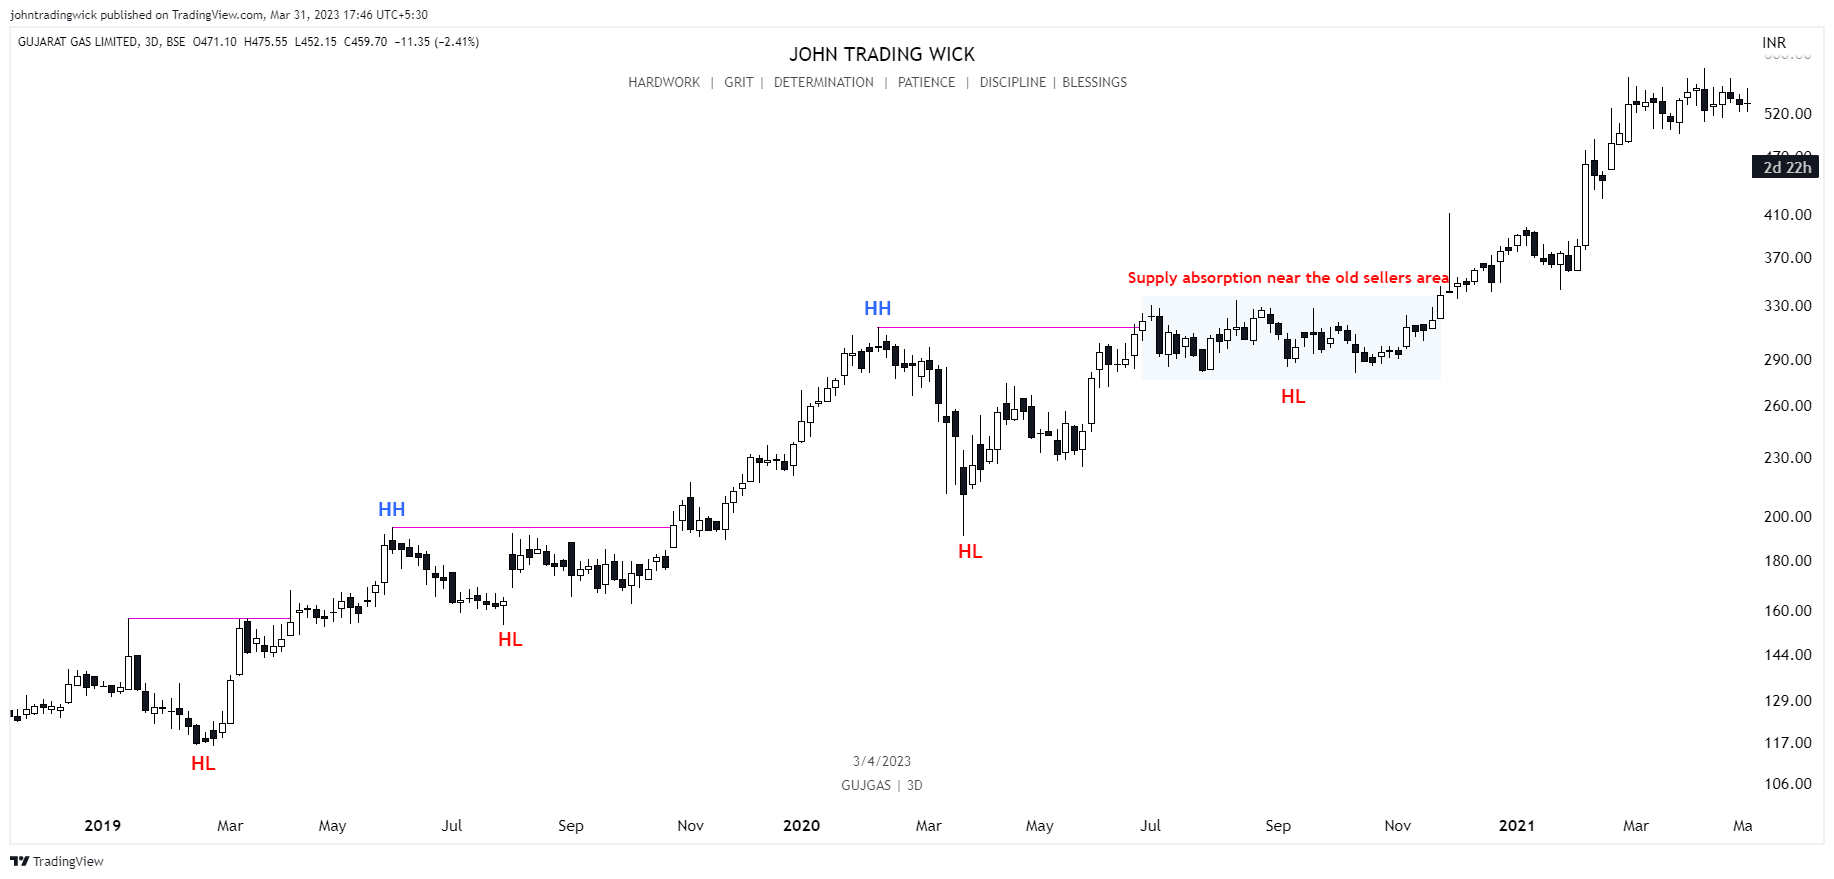
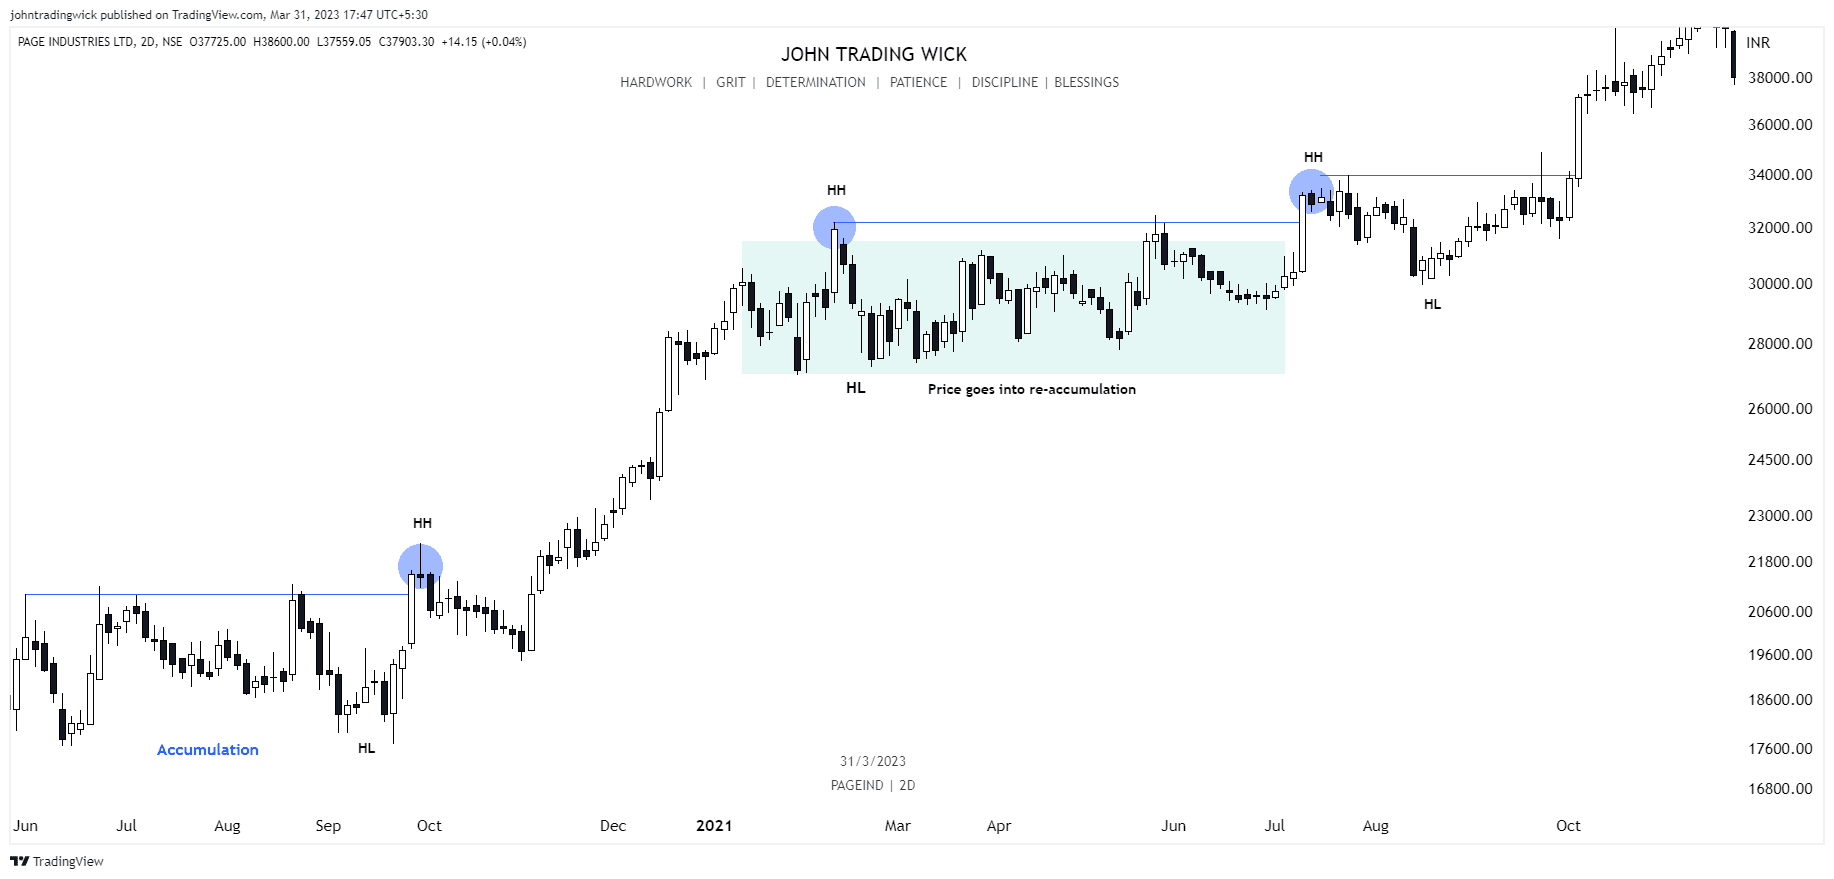
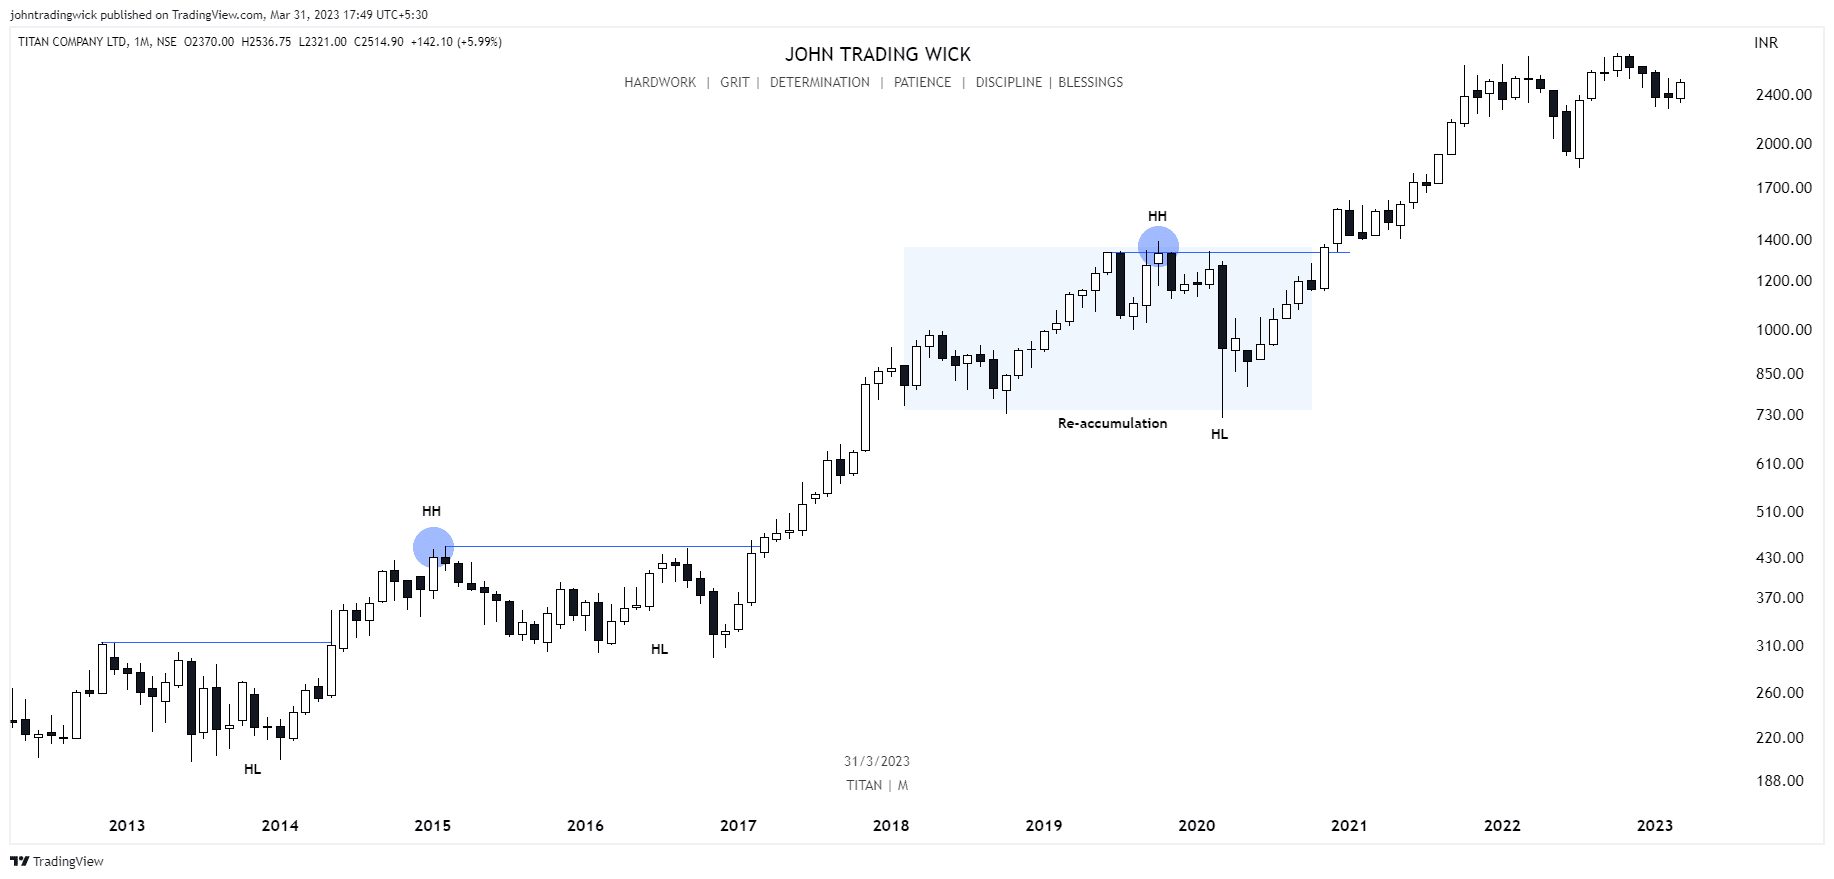
Some Examples of the Bullish Market Structure
Frequently Asked Questions (FAQs)
What does a bullish market structure indicate?
A bullish market structure indicates that the price is consistently making higher highs and higher lows, signaling an uptrend where demand exceeds supply.
How can I trade in a bullish market structure?
You can trade in a bullish market by buying during pullbacks to higher lows (buying the dip), entering breakouts when the price surpasses previous highs, or using trend-following indicators to confirm the trend.
What is the best indicator for confirming a bullish trend?
Moving averages (such as the 50-day and 200-day MA), RSI, and MACD are great indicators to confirm a bullish trend and help you avoid trading against the market.
What is a bear trap in a bullish market?
A bear trap occurs when the price temporarily breaks below a support level but quickly reverses back upward, trapping traders who entered short positions anticipating a bearish trend.
How do I know when a bullish market structure is ending?
A shift in structure, such as a lower low or lower high, could indicate the end of a bullish market. A trend reversal may also be confirmed if the price consistently breaks below previous higher lows.
Can a bullish market structure continue forever?
No, all markets eventually undergo corrections, consolidations, or trend reversals. However, understanding market structure helps you identify when the trend is shifting, allowing you to adjust your strategy accordingly.
Conclusion:
Mastering the concept of a bullish market structure is essential for any trader looking to capitalise on long-term trends. You may trade with the market rather than against it and make better decisions if you can recognise the pattern of higher highs and higher lows. Remember, buying the dip and waiting for breakouts are two key strategies that work well in a bullish trend.
Stay patient, keep practicing, and soon you’ll be able to spot bullish market structures in real-time, putting you on the path to becoming a more confident and successful trader. Happy trading!
Want more guides like this? Bookmark, share, and follow for clear, jargon-free investing wisdom — straight from someone who’s been there.


