
Every trader remembers that one moment—staring at a chart, watching price movements, and noticing something unusual. A smooth, curved shape begins to form among the noise of red and green candles. It doesn’t look like much at first, but the “U”-shaped structure becomes unmistakable as time passes. That’s the rounding bottom—a subtle yet powerful signal that a trend may be about to reverse.
Table Of Content
- What is a Rounding Bottom Pattern?
- Key Characteristics
- Phases of the Rounding Bottom Pattern
- 1. Decline Phase
- 2. Consolidation Phase
- 3. Accumulation Phase
- 4. Ascending Phase
- 5. Breakout Phase
- Trading the Rounding Bottom Pattern
- Entry Point
- Stop-Loss Placement
- Profit Target
- Real-Life Example
- Common Mistakes to Avoid
- Advanced Considerations
- 1. Volume Analysis
- 2. Time Frame Selection
- 3. Combining with Technical Indicators
- Closing Thoughts
- Frequently Asked Questions (FAQs)
- What is the Rounding Bottom pattern?
- How long does the Rounding Bottom pattern take to form?
- What confirms the Rounding Bottom pattern?
- How do I set a stop-loss for this pattern?
- How is the profit target calculated?
- Can the Rounding Bottom pattern fail?
- Is this pattern suitable for all time frames?
- Is the rounding bottom pattern suitable for all markets?
- Can I combine this pattern with other indicators?
- How do I identify the neckline in this pattern?
- Can the rounding bottom pattern be used in conjunction with fundamental analysis?
For many beginner traders, recognising this pattern marks a turning point. It’s often the first sign that charts aren’t just random lines—they tell stories, reveal psychology, and hint at what might come next. Understanding this one pattern can shift how you see the markets—and more importantly, how you trade them.
This guide delves deep into the intricacies of the Rounding Bottom pattern, providing advanced insights, strategic approaches, and practical examples to enhance your trading acumen.
What is a Rounding Bottom Pattern?

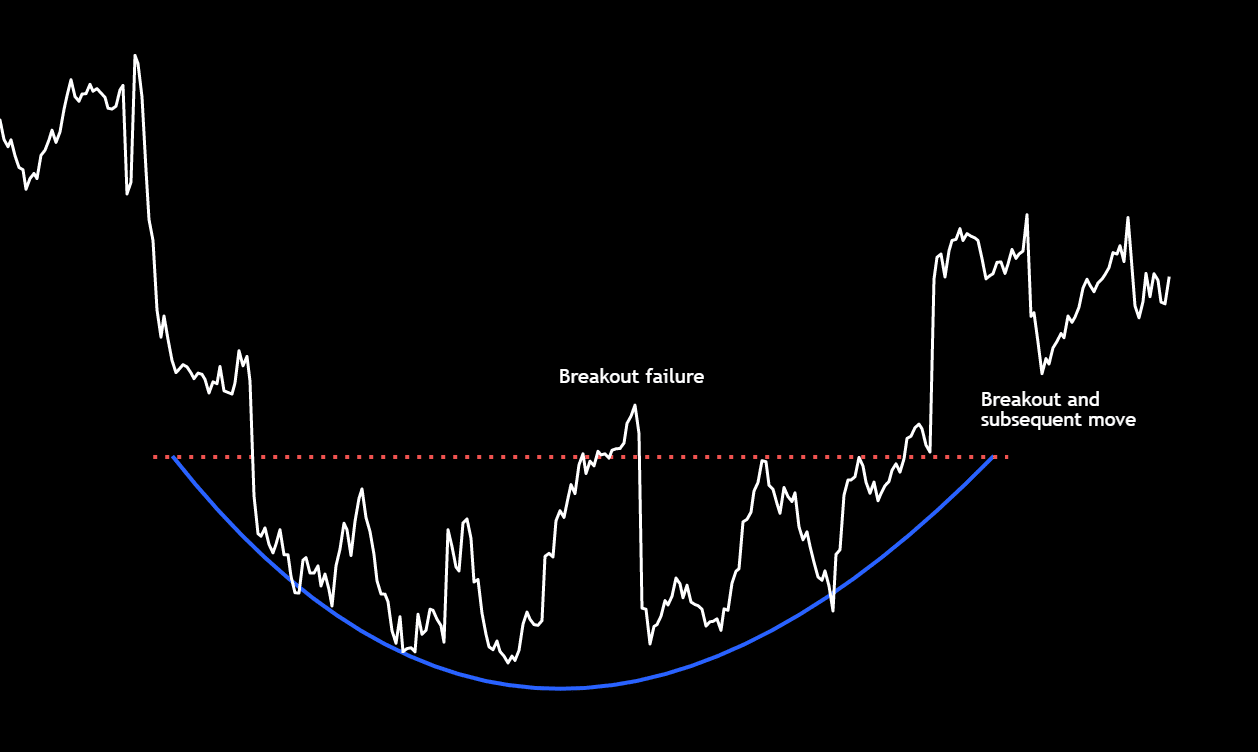
The rounding bottom is a bullish reversal chart pattern characterized by a gradual shift in price direction from a downtrend to an uptrend. It forms a smooth, curved “U” shape over time, reflecting a phase of decreasing selling pressure, followed by accumulation and increasing buying interest.
This pattern typically develops over a longer time frame and signals a potential end to a prolonged downtrend. A breakout above the resistance level (neckline) with increased volume confirms the pattern and suggests the beginning of a new uptrend.
Think of the rounding bottom like a ship slowly turning around. It doesn’t pivot sharply like a speedboat — instead, it gradually curves its way from a downward course to an upward one.
At first, momentum fades, the waters calm (price stabilizes), and then, little by little, the engines (buyers) kick in, steering the ship toward a new bullish journey. Once it’s clearly facing a new direction and picks up speed (breaks the neckline with volume), the course is set.
Key Characteristics:
- Shape: A smooth, rounded “U” formation.
- Trend Reversal: Appears after a downtrend, signalling a potential shift to an uptrend.
- Volume: It tends to decrease during the downtrend, remains low at the bottom, and increases during the uptrend, confirming the reversal.
- Duration: Can span several weeks to months, depending on the time frame.
- Breakout Point: A breakout is confirmed when the price moves above the neckline, accompanied by higher trading volume.
Phases of the Rounding Bottom Pattern
Understanding the distinct phases of the rounding bottom pattern is crucial for accurate identification and effective trading.

1. Decline Phase
Market sentiment during this phase is strongly bearish, characterised by persistent selling pressure and steadily declining prices. Volume typically starts elevated, reflecting aggressive distribution, and gradually tapers off as bearish momentum fades. Price action forms a consistent sequence of lower highs and lower lows, confirming the strength and structure of the prevailing downtrend.
2. Consolidation Phase
As the price reaches a support level, selling pressure diminishes, the market starts to stabilise, and the asset enters a period of consolidation. During this stage, trading volume usually declines, and the price flattens out, creating the bottom of the “U” shape.
3. Accumulation Phase
In this phase, informed investors and institutions begin accumulating the asset at lower prices, anticipating a reversal. The price starts to form the rounded base, and volume may remain low but starts to pick up gradually.

4. Ascending Phase
The price begins to rise steadily, reflecting growing bullish sentiment. Trading volume rises as additional market participants get involved, driving the price upward.

5. Breakout Phase
The pattern is confirmed when the price goes above the resistance level, also called the “neckline,” accompanied by higher volume. This breakout indicates a possible upward trend and presents a buying opportunity for traders.
Trading the Rounding Bottom Pattern
Entry Point
Enter the trade when the price breaks above the neckline level with significant volume. This breakout indicates a shift in market sentiment and the potential start of an uptrend.
Stop-Loss Placement
Place a stop-loss order below the lowest point of the rounding bottom to manage risk. This protects against potential false breakouts or unexpected market reversals.
Profit Target
Estimate the potential price target by measuring the distance from the bottom of the pattern to the resistance level. Add this distance to the breakout point to project the target price.

Real-Life Example
Consider a stock that declined from ₹150 to ₹100 over several months. It then formed a rounding bottom pattern over the next three months, with the resistance level at ₹120. Upon breaking above ₹120 with increased volume, the stock continued to rise, reaching a target of ₹140, calculated by adding the ₹20 depth of the pattern to the breakout point.
Common Mistakes to Avoid

- Premature Entry: Jumping in before the breakout is confirmed can backfire, leading to losses if the pattern doesn’t play out as expected.
- Ignoring Volume: Volume is a critical indicator. A breakout without increased volume may not be reliable.
- Skipping the Stop-Loss: Not setting a stop-loss can be costly if the market turns the other way, potentially leading to big losses.
- Overlooking Market Context: Always consider broader market trends and news that may impact the asset’s price.
- Lack of Patience: The Rounding Bottom pattern takes time to form; impatience can lead to missed opportunities or premature exits.
Advanced Considerations
1. Volume Analysis:
- Confirmation Tool: Analyzing volume helps confirm if the pattern is genuine. A strong rise in volume during the breakout makes the signal more trustworthy.
2. Time Frame Selection:
- Long-Term Patterns: The Rounding Bottom pattern is more reliable on longer time frames (daily, weekly charts), providing stronger signals for significant trend reversals.
3. Combining with Technical Indicators:
- Moving Averages: Check moving averages to verify the direction and strength of the trend.
- Relative Strength Index (RSI): Use RSI to spot overbought or oversold levels, helping you choose better entry and exit points.
Closing Thoughts
Mastering the rounding bottom pattern requires patience, practice, and continuous learning. My initial success with this pattern was not a one-time event but the beginning of a journey filled with both triumphs and setbacks. Each experience has been a stepping stone, reinforcing the importance of discipline, risk management, and ongoing education in trading.
Frequently Asked Questions (FAQs)
What is the Rounding Bottom pattern?
The Rounding Bottom is a bullish reversal pattern that signals a slow and steady transition from a downtrend to an uptrend. It forms a “U” shape on the chart, showing a period of stabilisation followed by growing buying interest.
How long does the Rounding Bottom pattern take to form?
It can take several weeks to months to form, depending on the time frame and market conditions.
What confirms the Rounding Bottom pattern?
A breakout above the resistance level (also called the neckline) with strong volume confirms the pattern.
How do I set a stop-loss for this pattern?
Place the stop-loss below the lowest point of the pattern or below the recent swing low within the bottom formation phase.
How is the profit target calculated?
Measure the vertical distance from the lowest point to the neckline and project this distance upward from the breakout point.
Can the Rounding Bottom pattern fail?
Yes, like all patterns, it can fail. Always use stop-loss orders and confirm the breakout with volume analysis.
Is this pattern suitable for all time frames?
While it can appear on various time frames, it is more reliable on longer time frames like daily or weekly charts.
Is the rounding bottom pattern suitable for all markets?
While commonly observed in stock markets, the rounding bottom pattern can also appear in commodities, forex, and cryptocurrency markets.
Can I combine this pattern with other indicators?
Yes, combining it with indicators like moving averages and RSI can enhance the reliability of the signals.
How do I identify the neckline in this pattern?
The neckline is the resistance level formed by the highest points on either side of the bottom formation.
Can the rounding bottom pattern be used in conjunction with fundamental analysis?
Yes, combining technical patterns with fundamental analysis provides a more comprehensive view of the asset’s potential.
Found this guide helpful? Feel free to bookmark it, share it with fellow traders, and follow along for more straightforward, experience-based insights. I’m simply here to share what I’ve learned along the way — no hype, just honest trading lessons.


