
When I started trading, I was overwhelmed. I still remember my first chart—candlesticks flying up and down, indicators blinking like Diwali and Christmas lights, and technical patterns I couldn’t make sense of. I lost money trying to trade every movement, constantly switching strategies. That’s when I came across a post from a trader on the Bullish Flag Pattern.
Table Of Content
- What is a Bullish Flag Pattern?
- The Psychology Behind the Bullish Flag Pattern
- 🛠 Anatomy of the Bullish Flag Pattern
- 1. The Flagpole
- 2. The Flag
- 3. The Breakout
- How to Identify a Bullish Flag in 5 Easy Steps
- 1. Identify a strong uptrend (the flagpole)
- 2. Look for a consolidation phase (the flag)
- 3. Draw flag boundaries
- 4. Analyse volume behaviour
- 5. Monitor for breakout confirmation
- Example: Real-Life Bullish Flag Pattern on Apple (AAPL)
- Price Target and Stop-Loss Placement
- Price Target
- Stop-Loss
- Common Mistakes Beginners Make
- Advanced Tips for Trading Bullish Flags
- Realistic Use Cases and Analogies
- Step-by-Step Guide to Trading the Bullish Flag Pattern
- 1. Spot the Pattern
- 2. Confirm with Volume
- 3. Define Your Entry Point
- 4. Set a Stop-Loss
- 5. Calculate the Profit Target
- When the Bullish Flag Fails
- Final Thoughts
- What is a bullish flag pattern in trading?
- How can I identify a bullish flag on a chart?
- What timeframes work best for this pattern?
- Is volume important in bullish flag patterns?
- How do I trade a bullish flag pattern?
- Can a flag pattern fail?
- Is the bullish flag the same as a pennant?
- How accurate is the bullish flag pattern?
- Can I use indicators with bullish flags?
- What causes the breakout in a bullish flag?
- What’s the ideal risk-reward ratio for this setup?
- Are bullish flags suitable for beginners?
If you only master a few chart patterns, let the Bullish Flag be one of them. It’s like reading the market’s heartbeat.
Today, I use this pattern as one of my go-to setups, and it’s helped me make consistently smarter trades—especially when the market gets noisy.
If you’re new or still learning, this post is for you. Let’s break it all down—no jargon, just clarity and practical insights.
What is a Bullish Flag Pattern?
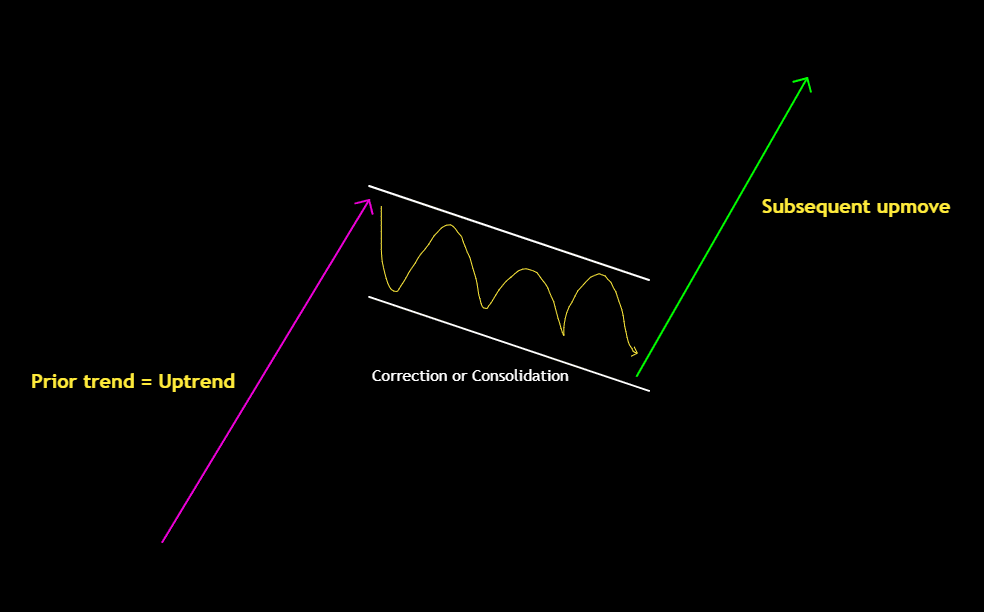
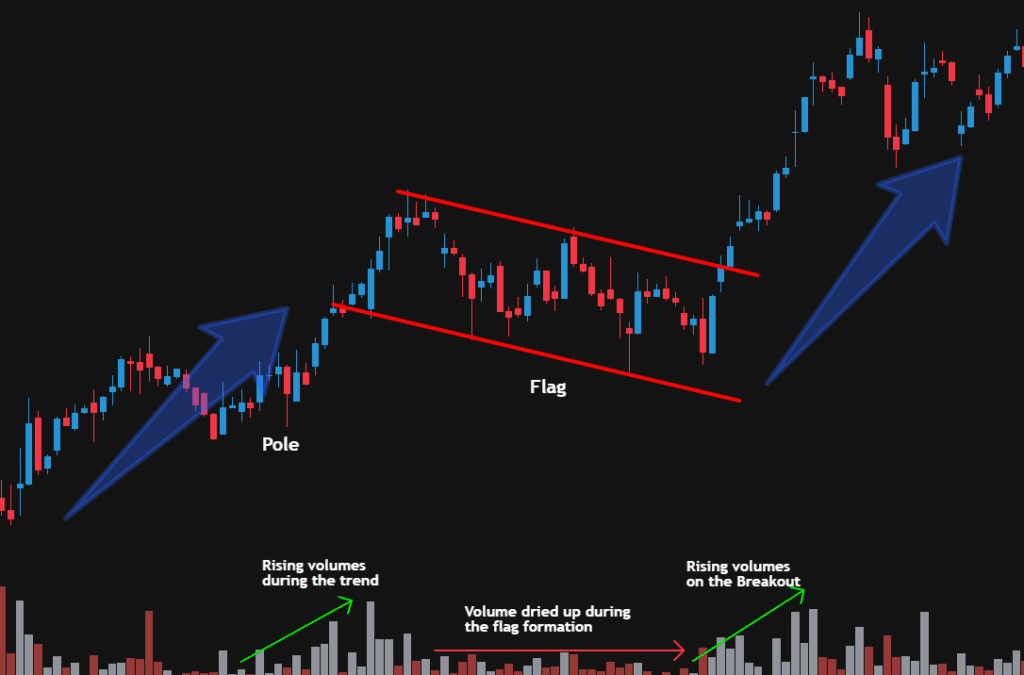
The Bullish Flag Pattern is one of those classic continuation setups that shows up in strong uptrends—like a quick breather before the next sprint. It’s called a “flag” for a reason: on the chart, it actually looks like one.
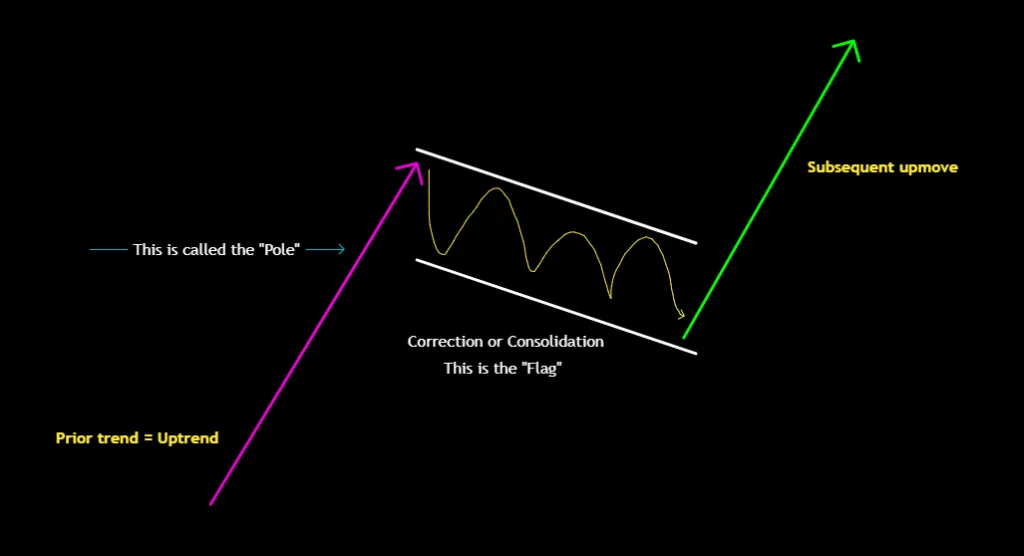
The pattern gets its name because it resembles a flag on a pole:
- The flagpole represents a sharp upward move, often supported by strong volume. This shows aggressive buying interest.
- The flag is a brief consolidation period during which the price trades sideways or dips slightly within a tight range. This is a healthy pause, not a reversal—buyers are catching their breath.
- The breakout happens when price moves above the upper boundary of the flag, resuming the uptrend.
Think of it like a runner in a race:
The flagpole is the sprint, the flag is a quick rest or slow jog, and the breakout is when the runner picks up speed again and pushes forward.
For traders, this pattern can offer a good opportunity to enter the market during consolidation—positioning ahead of the next potential leg up.
The Psychology Behind the Bullish Flag Pattern
Understanding the psychology behind the bullish flag pattern can enhance your ability to trade it effectively:
- Initial Surge (Flagpole): A strong upward move often results from positive news or increased buying pressure. Traders rush in, driving the price higher. Volume spikes. Price shoots up.
- Rest Phase (Flag): After the initial surge, early buyers may take profits, and new traders might hesitate, leading to a period of consolidation. This phase reflects a balance between buyers and sellers.
- Breakout: As confidence returns, buyers re-enter the market, pushing the price above the consolidation range, signaling the continuation of the uptrend.
In essence, the flag represents healthy consolidation—a pause, not a reversal.
🛠 Anatomy of the Bullish Flag Pattern
1. The Flagpole
- Represents strong buying momentum
- Caused by news, earnings, market sentiment, or institutional buying
- Often comes with high volume
🧪 Pro Tip: The steeper and longer the pole, the stronger the setup. But avoid “parabolic” moves—they often collapse just as fast.
2. The Flag
- Occurs after the sharp move up
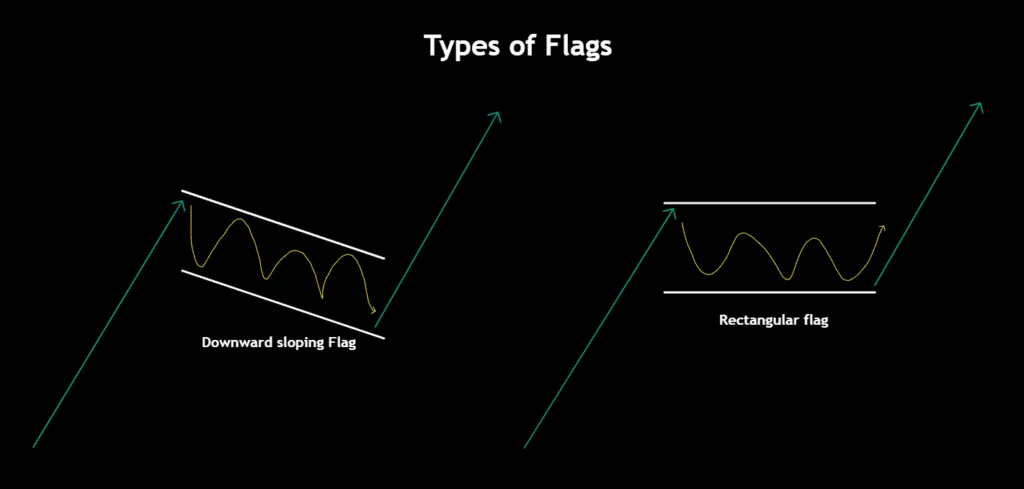
- Forms a rectangle or slight downward channel
- Lasts a few days to a few weeks
- Volume declines during this phase
📊 Visual Tip: Draw two parallel lines around the flag’s high and low—it should form a compact range.
3. The Breakout
- Happens when price breaks above the flag’s resistance
- Volume should increase again, confirming buyer strength
- Entry signals for traders
How to Identify a Bullish Flag in 5 Easy Steps
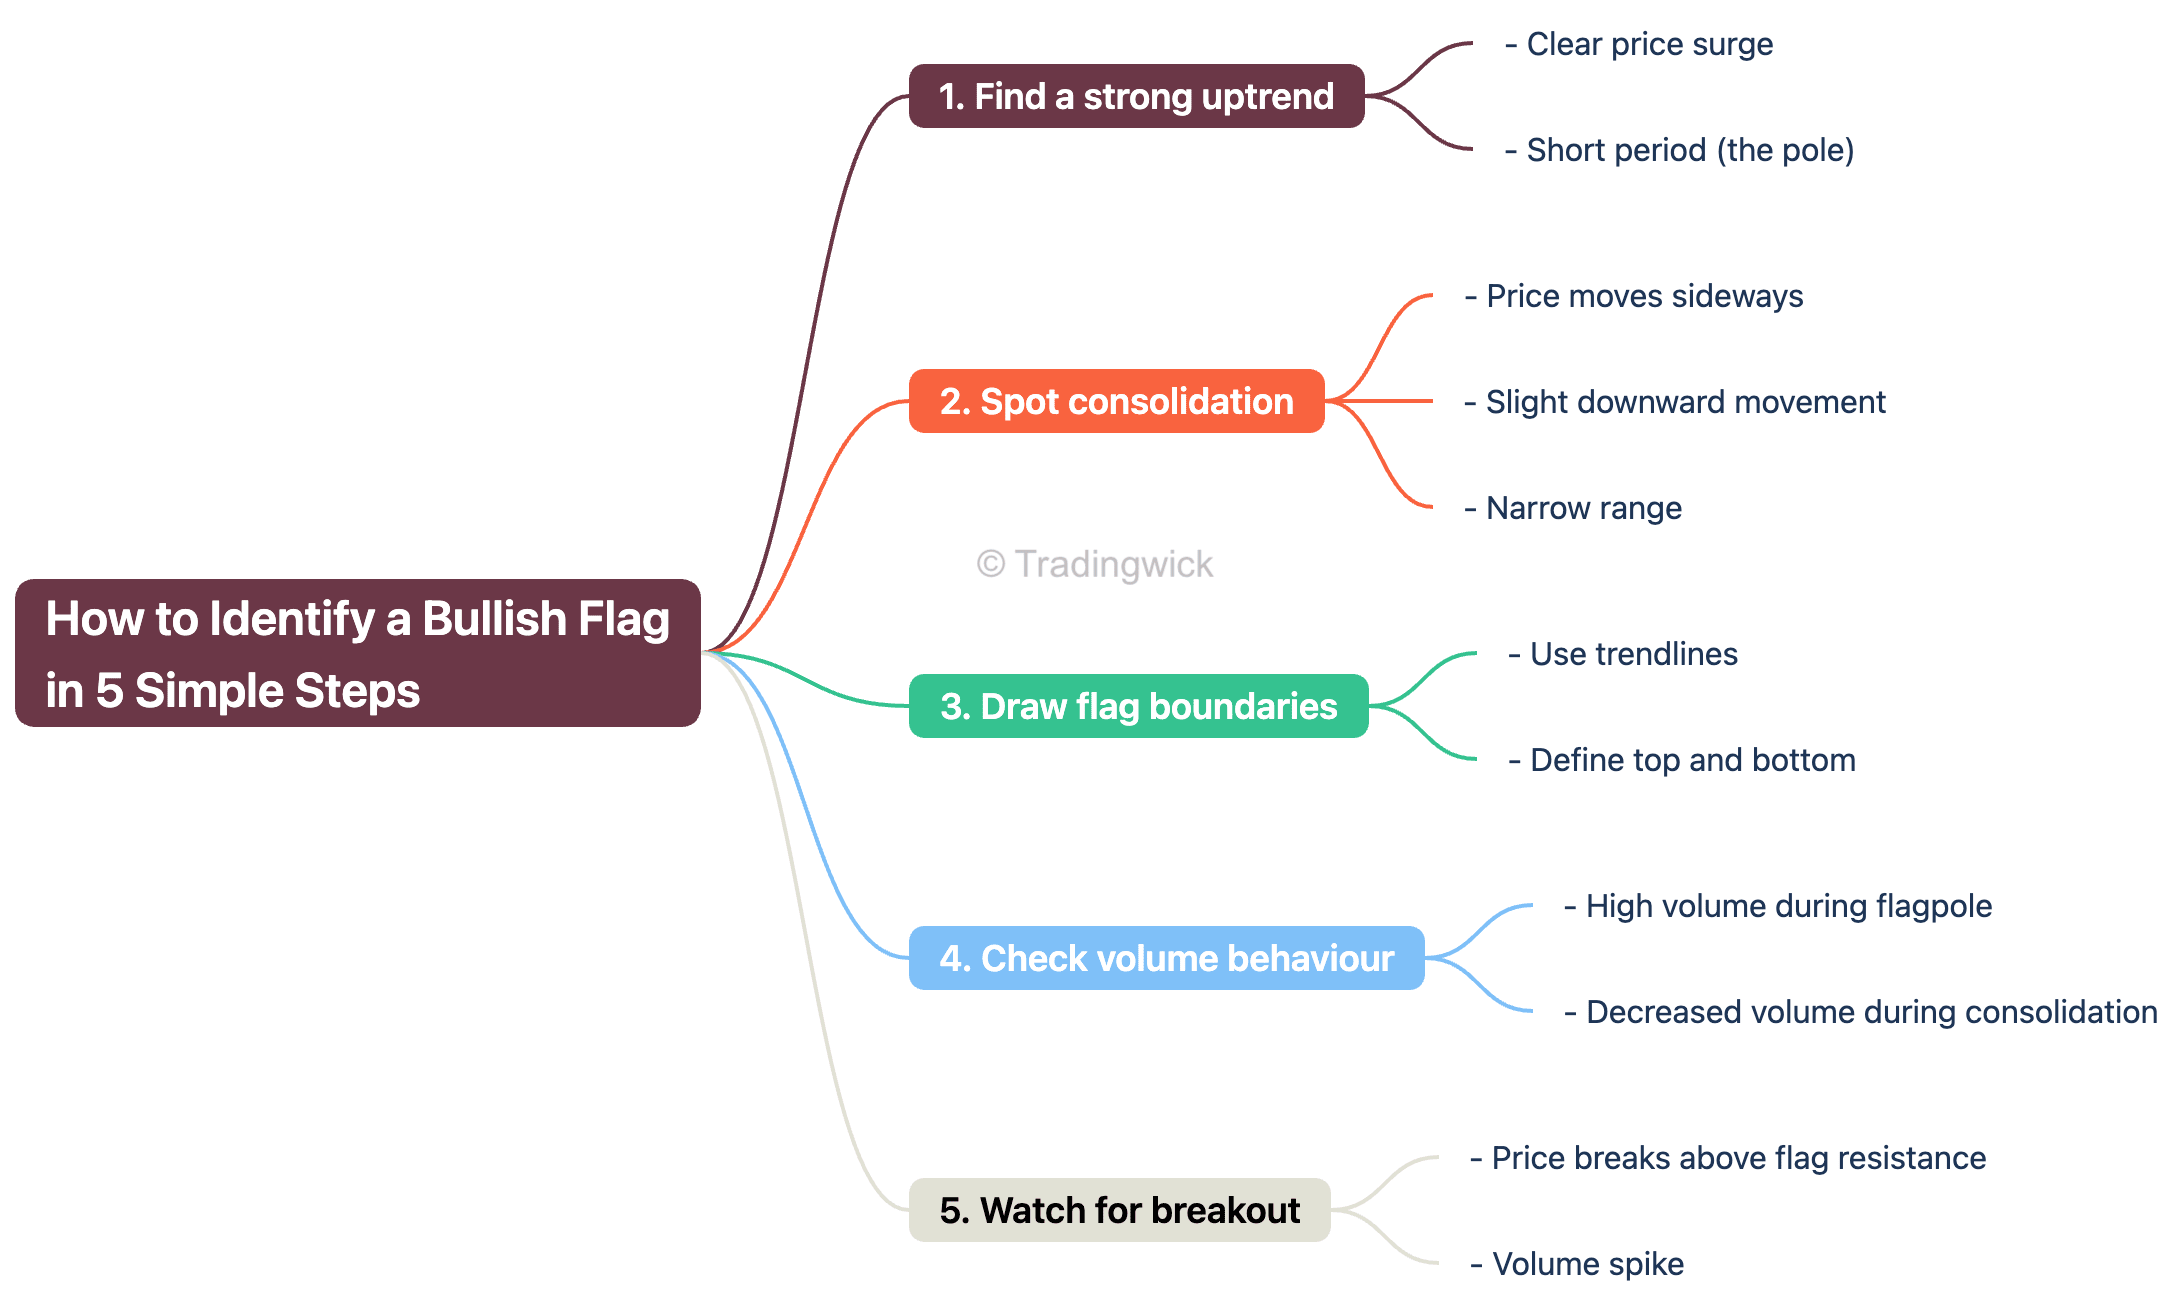
1. Identify a strong uptrend (the flagpole):
Begin by spotting a sharp and sustained upward price movement over a relatively short time. This vertical rise—known as the flagpole—should stand out clearly on the chart. Ideally, it’s supported by high volume, signaling strong buying interest and momentum behind the move.
2. Look for a consolidation phase (the flag):
After the initial surge, price enters a brief pause. During this phase, it should move in a tight range—either sideways or slightly downward. This consolidation forms the flag portion of the pattern and reflects a temporary market equilibrium between buyers and sellers.
3. Draw flag boundaries:
Use trendlines to connect the swing highs and lows during the consolidation phase following a strong price movement. These trendlines outline a compact, downward-sloping or horizontal channel, commonly called the “flag.” This structure reflects a temporary pause or pullback in the prevailing trend.
The pattern becomes more trustworthy when the flag’s boundaries are relatively parallel and the price remains confined within a tight range, as it indicates controlled consolidation rather than erratic price behaviour. Such well-formed flags often signal a continuation of the original trend once a breakout occurs.
4. Analyse volume behaviour:
Volume is a key confirmation tool. Look for high volume during the initial uptrend (flagpole), followed by a noticeable drop in volume during the consolidation. This quiet phase shows that buyers are taking a break, not abandoning the move.
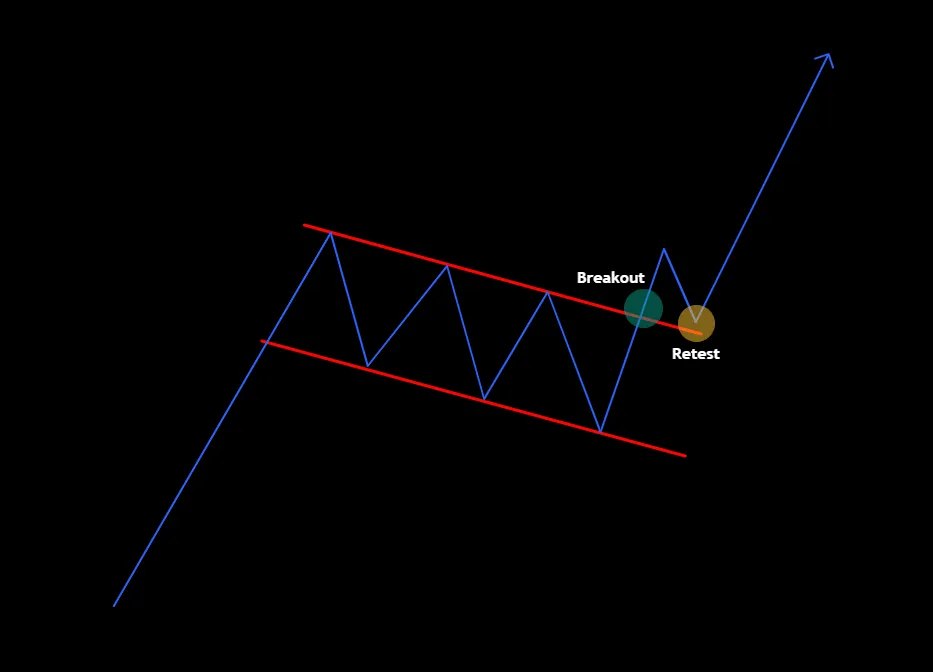
5. Monitor for breakout confirmation:
A breakout is seen as valid when the price climbs above the top edge of the flag, especially if it happens with a noticeable increase in trading volume. This shows that buyers are coming back in force, signaling that the uptrend might be ready to continue.
Think of the flag as a lid holding steam in a pot. When enough pressure builds (volume), the lid pops off (breakout), and the steam shoots upward—just like the price might after a strong breakout.
Optional Tip: To estimate a possible price target, measure the height of the flagpole and extend that distance upward from the breakout level. This provides an approximate projection of how far the next move in the trend could reach.
Example: Real-Life Bullish Flag Pattern on Apple (AAPL)
Let’s take an example from 2020:
- Pole: Apple surged 18% in 10 trading days after a strong earnings report.
- Flag: Price drifted sideways for 5 days in a narrow range.
- Breakout: Price broke above resistance on day 6 with increased volume.
- Outcome: AAPL rallied another 12% in the next 2 weeks.
This classic bullish flag played out exactly as expected.
Another example is Tesla Inc. (TSLA), which experienced a significant price increase from $200 to $250 over a few days, forming the flagpole. Subsequently, the price consolidated between $245 and $250 for a brief period, creating the flag. Upon breaking above $250 with increased volume, the price continued its upward trend, validating the bullish flag pattern.
Price Target and Stop-Loss Placement
Price Target
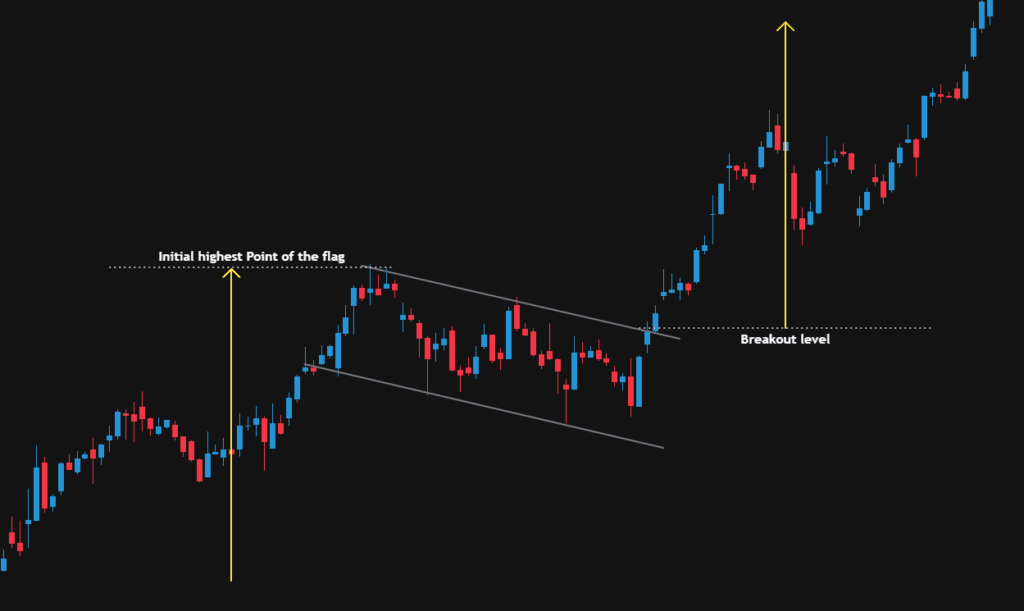
The projected target for a bullish flag pattern is usually calculated by adding the height of the flagpole to the breakout point. This gives an estimate of how far the price might move once the pattern completes.
Target = Flag Breakout Point + Length of the Pole
If the pole is 10 points tall and the breakout is at $100, your target price is $110.
Stop-Loss
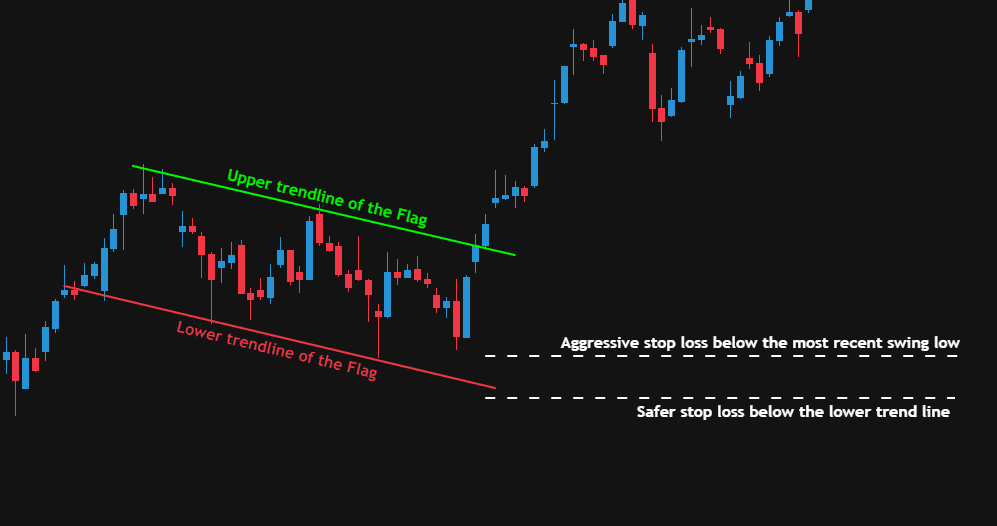
Two reliable options:
- Just below the flag’s lower boundary
- Below the most recent swing low
This helps limit your downside if the pattern fails.
Common Mistakes Beginners Make
Avoid these traps when trading bullish flags:
- Entering too early before the breakout confirmation.
- Ignoring volume, especially on the breakout.
- Forcing the pattern—not every consolidation is a flag.
- No stop-loss, leading to large unexpected losses.
- Trading against trend—bullish flags only work in uptrends.
🎯 Golden Rule: Wait for the breakout. Don’t anticipate it.
Advanced Tips for Trading Bullish Flags
- Use Technical Indicators: Combine the bullish flag pattern with indicators like Moving Averages or RSI to strengthen your analysis.
- Monitor News and Events: Stay informed about news that may impact the asset, as it can influence the pattern’s outcome.
- Practice Patience: Wait for clear confirmation before entering the trade to avoid false breakouts.
- Backtest Strategies: Test your approach on historical data to assess its effectiveness and refine your strategy.
Implementing these advanced techniques can improve your trading performance and confidence.
Realistic Use Cases and Analogies
Think of the bullish flag like a sprinter pausing after a powerful dash. They breathe, reset, then run again. That’s the market behaviour captured in this pattern.
Or imagine a rocket launching (flagpole), hovering mid-air (flag), then igniting its second booster (breakout).
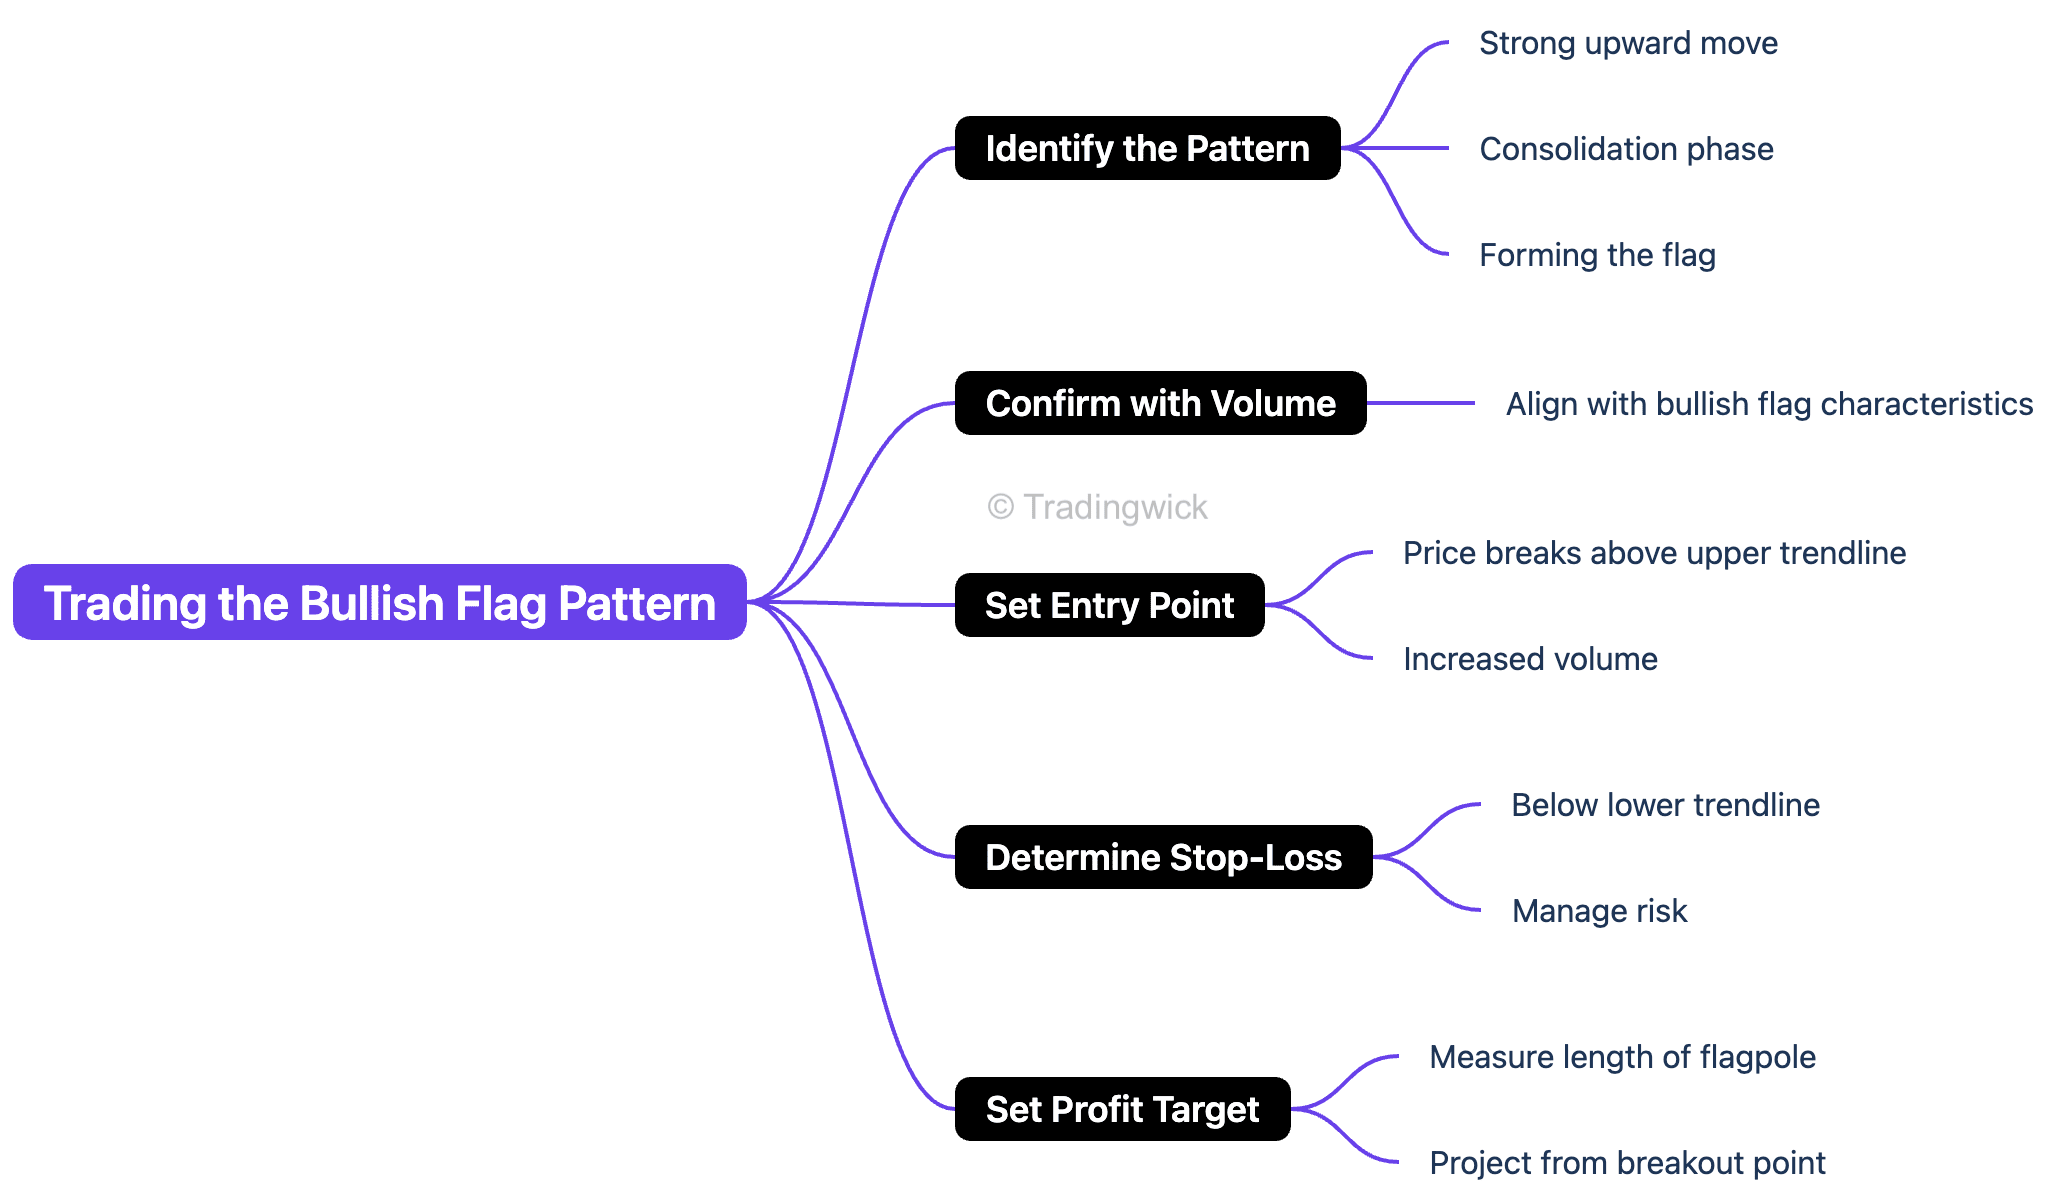
Step-by-Step Guide to Trading the Bullish Flag Pattern
1. Spot the Pattern:
Start by identifying a strong upward price movement—this is known as the flagpole. After this surge, look for a brief consolidation where the price moves sideways or slightly downward within parallel trendlines. This consolidation forms the flag.
2. Confirm with Volume:
Check if volume supports the pattern. Ideally, volume should be high during the flagpole’s formation, then decrease during the consolidation phase. A noticeable spike in volume during the breakout strengthens the bullish signal.
3. Define Your Entry Point:
Plan to enter the trade when the price breaks above the upper boundary of the flag. For greater confirmation, look for a breakout that occurs alongside a rise in volume, indicating strong buying interest.
4. Set a Stop-Loss:
To manage risk, place a stop-loss just below the lower trendline of the flag. This protects your capital in case the breakout fails and the price reverses.
5. Calculate the Profit Target:
Estimate how far the price might move by measuring the height of the flagpole—the initial sharp move upward—and projecting that same distance upward from the breakout point. This gives you a realistic price target for the next leg of the trend.
When the Bullish Flag Fails
No pattern is perfect. Flags can fail due to:
- Weak volume on breakout
- Market-wide corrections
- Fakeouts triggered by algos
Be disciplined. Use stop-losses. Don’t marry the trade.
Final Thoughts
I remember one day I was watching Bitcoin surge after news. It formed a clear bullish flag over the next few hours. I hesitated. “What if it fails?” I thought.
But I stuck to the rules. Volume surged on breakout—I entered. Within hours, I was up 10%. That wasn’t just a profit—it was validation. That day, the Bullish Flag stopped being theory and became a real, reliable tool.
You don’t need to master a hundred patterns. Start with a few solid ones. The bullish flag is one you’ll thank yourself for learning.
Frequently Asked Questions (FAQs)
What is a bullish flag pattern in trading?
A continuation pattern signaling that an uptrend will likely resume after a brief consolidation phase.
How can I identify a bullish flag on a chart?
Look for a strong upward move (flagpole), followed by sideways or slightly downward movement (flag), then a breakout.
What timeframes work best for this pattern?
It works on all timeframes but is most reliable on 1-hour, 4-hour, or daily charts.
Is volume important in bullish flag patterns?
Yes. Volume should rise during the flagpole and breakout, and dip during the flag.
How do I trade a bullish flag pattern?
Buy the breakout above the flag with volume. Use the pole’s length for your target and place a stop-loss below the flag.
Can a flag pattern fail?
Yes. Not all patterns play out. Always follow proper risk management practices to protect your capital.
Is the bullish flag the same as a pennant?
Not quite. A flag forms a rectangular or parallel channel, usually sloping slightly against the prevailing trend. A pennant, on the other hand, forms a small symmetrical triangle as the price converges. Despite their shape differences, both are continuation patterns that signal a possible resumption of the prior trend.
How accurate is the bullish flag pattern?
Historically, it has a high success rate when traded with volume confirmation and proper risk control.
Can I use indicators with bullish flags?
Yes. RSI, MACD, and moving averages can add confirmation, but aren’t required.
What causes the breakout in a bullish flag?
Renewed buying interest, institutional entry, or short squeezes after the flag consolidation phase.
What’s the ideal risk-reward ratio for this setup?
Aim for 1:2 or better—meaning for every $1 risked, target at least $2.
Are bullish flags suitable for beginners?
Absolutely. They’re visually simple, psychologically logical, and teach essential trading principles.
If you found this guide helpful, consider sharing it with fellow traders. Bookmark, share, and follow for clear, jargon-free investing wisdom — straight from someone who’s been there.


